Quantcast
Channel: Weberblog.net
Viewing all 340 articles
Browse latest View live

FortiGate Virtual IPs with Interface “Any”

$
0
0
FortiGate VIP with Interface featured image

On the FortiGate firewall, address objects and virtual IPs (VIPs) can be set up with an interface. For address objects this has no technical relevance – the address objects simply only appear on policies if the appropriate interface is selected. But for virtual IPs, this setting has relevance on how connections are NATed. This can be problematic.

In common situations, you have only one ISP connection on which you want to set up a destination NAT (DNAT) for incoming connections. No problem there. You can select the untrust interface in the virtual IP object. If you have two ISP connections, e.g., a good one (ISP1) and a cheap one (ISP2), you MUST select the interface in the virtual IP object if it references a static IP address of ISP1. Otherwise it will be used on all outgoing connections which won’t work with ISP2.

FortiGate VIP with Interface Visio 01

The following example shows a virtual IP object with a static IP address of 80.154.108.233 and a misconfigured interface of “Any”. Using outgoing connections to ISP1, there are no problems (label 1 on the screenshot). But after setting up a policy route to route http traffic to ISP2, the same source NAT IP will be used which obviously didn’t work (label 2). After setting the interface to “wan1” in the virtual IP object, outgoing connections to ISP2 are correctly NATed to the outgoing interface address while outgoing connections to ISP1 are still NATed to the virtual IP (label 3). Tested with a FortiGate 100D with software version v5.2.5, build701.

Virtual IP with Interface Any. Outgoing connections with wrong and correct SNATs.

Problem

However, one problem remains unsolved: If you have more than one interface on which the virtual IP must be used (e.g., for ISP1 and for a site-to-site VPN connection that also talks to the NATed IP), while some connections are policy routed to ISP2.

FortiGate VIP with Interface Visio 02

In this situation, you MUST set the interface inside the virtual IP to “Any”, which will not work with ISP2. One idea might be to to configure several virtual IPs with the same external/mapped IPs with different interfaces, but this is not possible to configuration restrictions. :( In this case, some more security policy entries with IP pools can be used to solve the problem.

(By the way: A problem we won’t have with IPv6 anymore.)


FortiGate Virtual IPs without Reference

$
0
0
FortiGate VIP SNAT featured image

Migrating from Juniper ScreenOS firewalls to FortiGates, there are some differences to note with static NATs, i.e., Mapped IPs (MIPs) on a Netscreen and Virtual IPs (VIPs) on a FortiGate. While the Juniper MIPs on an interface are always used by the firewall whenever a packet traverses the interface, the virtual IP objects on a FortiGate must be used at least once in the security policy before they are really used by the firewall.

Issue

I faced an issue (or let’s say, a configuration mistake) with some Virtual IP (VIP) objects: (Tested with a FortiGate 500D with firmware version v5.2.7, build718.)

  • Many VIPs were configured but not all of them were used in the security policy, i.e., had a reference counter of 0.
  • A global rule allows basic Internet usage with source-NAT of “Use Outgoing Interface Address”.
  • Only those servers which VIP was used in the policy (even though on other rules!) used the correct virtual IP for outgoing connections.
  • All servers which VIP was not used in the policy simply used the mere interface IP address.
  • Note that in any case a global policy rule was used for outgoing connections, not that one which used the VIP object. That is, the VIP must only be referenced once in the complete security policy and is then used for all outgoing connections, regardless of the used policy rule.

(On a Juniper SSG firewall, the MIPs were used for all outgoing connections, no matter if there even existed one policy referring to this MIP.)

Workaround

I created a workaround for this case. I configured a dummy rule for incoming connections to this VIP in order to reference the VIP object at least once in the security policy rule set. Therefore all outgoing connections from the internal servers are correctly source-NATed to their corresponding virtual IPs. With this workaround, all global policy rules must not be altered to use different IP pools or the like.

Let’s have a look at the following screenshots. See the descriptions below them:

Global outgoing "Basic Internet" rule with NAT enabled. Details of the rule. Virtual IP (VIP) object that is not referenced anywhere. Forward Traffic Log: Outgoing connections are still NATted to the interface IP address! dummy-for-nat-1.2.3.4 policy rule is created for incoming connections referencing the VIP object (though not needed in this way). Now, outgoing connections are translated correctly to the VIP object.

Note that the “Central NAT” could probably solve this issue but would require some other configurations. Each inside host would need its own IP pool with one single untrust IP address referenced in this central NAT rule. Furthermore, each security policy would need a clone of itself, one with the “Central NAT” and one with the “Use Outgoing Interface Address”.

The “set nat-source-vip {disable|enable}” CLI config within the “config firewall vip” is not helping here. It was no difference between an enabled or disabled command.

Links

IPv6 through IPv4 VPN Tunnel with Palo Alto

$
0
0
IPv6 through IPv4 VPN Tunnel

The most common transition method for IPv6 (that is: how to enable IPv6 on a network that does not have a native IPv6 connection to the Internet) is a “6in4” tunnel. Other tunneling methods such as Teredo or SixXS are found on different literatures as well. However, another method that is not often explained is to tunnel the IPv6 packets through a normal VPN connection. For example, if the main office has a native IPv6 connection to the Internet as well as VPN connections to its remote offices, it is easy to bring IPv6 subnets to these stations. Here comes an example with two Palo Alto firewalls.

(This post is very similar to this one in which I covered Juniper ScreenOS firewalls.)

I assume that there is already a VPN connection between two Palo Alto firewalls in place. If so, the steps to tunnel IPv6 through this VPN tunnel are quite easy. (Note that this is NOT a 6in4 tunnel! It is simply a forwarding of IPv6 packets through a common IPsec site-to-site VPN.)

Tunneling

I am using two PA-200 firewalls with PAN-OS 7.1.1. One firewall has a static IPv4 address, the other one is dynamic. I am routing a /60 through the tunnel to have a maximum of 16 subnets on the remote site. This is how the lab looks like:

IPv6 through IPv4 VPN Tunnel Palo Alto - Lab

The basic step is to enable IPv6 on the tunnel interfaces and to route the IPv6 traffic appropriately. Of course, all other interface configuration steps such as router advertisements as well as security policies must be configured, too.

Main Site

These are the configuration steps on the main site in order to route the IPv6 subnet through the tunnel. See the screenshot descriptions for more details:

Tunnel Interface number 6 with activated IPv6. IKE Gateway with address type of IPv4. Same for the IPsec Tunnel. This is the IPv6 route with the /60 subnets into the tunnel interface. And some security policies allowing anything from "vpn-s2s" to "untrust", etc.

Remote Site

Very similar: the remote site. Note the default IPv6 route through the tunnel:

Normal Layer 3 interface with static (!) IPv6 address configuration. Tunnel Interface with IPv6. IKE Gateway over IPv4. Same for the IPsec Tunnel. But a default IPv6 route into the tunnel! And one single very open security policy into/from trust to vpn-s2s.

Latency & Hop Count

After committing everything the traffic log shows some IPv6 connections, either from trust to vpn-s2s (on the remote site), or from vpn-s2s to untrust (on the main site):

Remote Site Traffic Log from "trust" to "vpn-s2s". Main Site Traffic Log from "vpn-s2s" to "untrust".

It is interesting to see the IPv6 ping times from the remote site compared to the IPv4 ping times. Since the IPv6 connections must travel through the IPv4 VPN tunnel via the Internet before reaching the real destination, the RTT should be much higher than the IPv4 times. However, everything is relative. 😉 
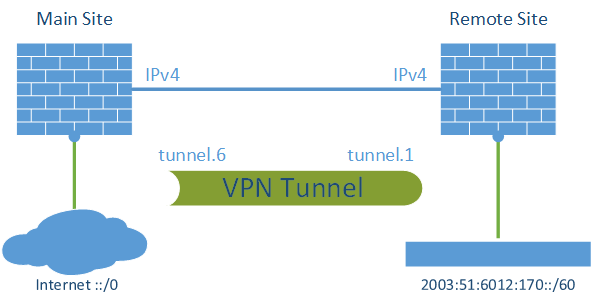
The ping times (IPv6 and IPv4) on my main site are both around 5-8 ms in the following example:

C:\Users\weberj>ping -4 www.insinuator.net

Ping wird ausgeführt für www.insinuator.net [62.159.96.203] mit 32 Bytes Daten:
Antwort von 62.159.96.203: Bytes=32 Zeit=8ms TTL=57
Antwort von 62.159.96.203: Bytes=32 Zeit=6ms TTL=57
Antwort von 62.159.96.203: Bytes=32 Zeit=8ms TTL=57
Antwort von 62.159.96.203: Bytes=32 Zeit=5ms TTL=57

Ping-Statistik für 62.159.96.203:
    Pakete: Gesendet = 4, Empfangen = 4, Verloren = 0
    (0% Verlust),
Ca. Zeitangaben in Millisek.:
    Minimum = 5ms, Maximum = 8ms, Mittelwert = 6ms

C:\Users\weberj>
C:\Users\weberj>
C:\Users\weberj>ping -6 www.insinuator.net

Ping wird ausgeführt für www.insinuator.net [2003:60:4010:11b0::12] mit 32 Bytes Daten:
Antwort von 2003:60:4010:11b0::12: Zeit=5ms

Ping-Statistik für 2003:60:4010:11b0::12:
    Pakete: Gesendet = 4, Empfangen = 4, Verloren = 0
    (0% Verlust),
Ca. Zeitangaben in Millisek.:
    Minimum = 5ms, Maximum = 5ms, Mittelwert = 5ms


But since my remote site is a DSL connection with a slower latency at all, the IPv6 burden is not that high, as seen here. Both connections are around 30 ms:

C:\Users\Johannes Weber>ping -4 www.insinuator.net

Ping wird ausgeführt für www.insinuator.net [62.159.96.203] mit 32 Bytes Daten:
Antwort von 62.159.96.203: Bytes=32 Zeit=32ms TTL=54
Antwort von 62.159.96.203: Bytes=32 Zeit=31ms TTL=54

Ping-Statistik für 62.159.96.203:
    Pakete: Gesendet = 4, Empfangen = 4, Verloren = 0
    (0% Verlust),
Ca. Zeitangaben in Millisek.:
    Minimum = 31ms, Maximum = 32ms, Mittelwert = 31ms

C:\Users\Johannes Weber>
C:\Users\Johannes Weber>ping -6 www.insinuator.net

Ping wird ausgeführt für www.insinuator.net [2003:60:4010:11b0::12] mit 32 Bytes Daten:
Antwort von 2003:60:4010:11b0::12: Zeit=35ms
Antwort von 2003:60:4010:11b0::12: Zeit=29ms
Antwort von 2003:60:4010:11b0::12: Zeit=30ms
Antwort von 2003:60:4010:11b0::12: Zeit=29ms

Ping-Statistik für 2003:60:4010:11b0::12:
    Pakete: Gesendet = 4, Empfangen = 4, Verloren = 0
    (0% Verlust),
Ca. Zeitangaben in Millisek.:
    Minimum = 29ms, Maximum = 35ms, Mittelwert = 30ms


That’s it.

Advanced Ping: httping, dnsping, smtpping

$
0
0
Pings featured image

I really love ping! It is easy to use and directly reveals whether the network works or not. Refer to Why Ping is no Security Flaw! (But your Friend) and Advanced Tracerouting. At least outgoing pings (from trust to untrust) should be allowed without any security concerns. However, many companies are denying these ICMP echo-requests from untrust into the DMZ which makes it difficult to test whether all servers are up and running.

I was sitting at the customer’s site replacing the DMZ firewall. Of course I wanted to know (from the outside) whether all servers are connected correctly (NAT) and whether the firewall permits the connections (policy). However, ping was not allowed. Therefore I used several layer 7 ping tools that generate HTTP, DNS, or SMTP sessions (instead of ICMP echo-requests) and revealed whether the services (and not only the servers) were running. Great!

This post shows the installation and usage of httping, dnsping, and smtpping on a Linux machine, in my case a Ubuntu server 14.04.4 LTS, as well as some Wireshark screenshots from captured sessions.

httping

As the name implies, httping sends HTTP requests. Note that the name of the tool has only one “p” in its spelling. The tool is available at GitHub. Some information about it can be seen here. The installation process looks as follows:

sudo apt-get install libncursesw5-dev libssl-dev libfftw3-dev gettext
git clone https://github.com/flok99/httping.git
cd httping/
sudo make install

(Note that a simple

sudo apt-get install httping
  delivers a very old version of httping and is not recommended.)

For a basic functionality it only needs the hostname as an option, such as

httping blog.webernetz.net
. Many more options are available and it also supports HTTPS with SSL/TLS. Examples:
weberjoh@jw-nb12:~$ httping blog.webernetz.net
PING blog.webernetz.net:80 (blog.webernetz.net):
connected to 80.237.133.136:80 (400 bytes), seq=0 time=381.24 ms
connected to 80.237.133.136:80 (400 bytes), seq=1 time=394.30 ms
connected to 80.237.133.136:80 (400 bytes), seq=2 time=373.54 ms
connected to 80.237.133.136:80 (400 bytes), seq=3 time=370.39 ms
connected to 80.237.133.136:80 (400 bytes), seq=4 time=396.91 ms
^CGot signal 2
--- blog.webernetz.net ping statistics ---
5 connects, 5 ok, 0.00% failed, time 6408ms
round-trip min/avg/max = 370.4/383.3/396.9 ms
weberjoh@jw-nb12:~$
weberjoh@jw-nb12:~$
weberjoh@jw-nb12:~$
weberjoh@jw-nb12:~$ httping -6 https://www.insinuator.net/
Auto enabling SSL due to https-URL
PING www.insinuator.net:443 (/):
connected to [2003:60:4010:11b0::12]:443 (279 bytes), seq=0 time=685.03 ms
connected to [2003:60:4010:11b0::12]:443 (279 bytes), seq=1 time=712.15 ms
connected to [2003:60:4010:11b0::12]:443 (279 bytes), seq=2 time=631.81 ms
connected to [2003:60:4010:11b0::12]:443 (279 bytes), seq=3 time=722.95 ms
^CGot signal 2
--- https://www.insinuator.net/ ping statistics ---
4 connects, 4 ok, 0.00% failed, time 6228ms
round-trip min/avg/max = 631.8/688.0/723.0 ms
weberjoh@jw-nb12:~$

Following is a screenshot from httping with the color mode (-Y) and the –threshold-red and –threshold-yellow parameters (which I really like), as well as two screenshots from Wireshark, one with an http session (note the SYN packets as well as the HEAD request and 200 OK answer) and one with a https session (Client Hello, Application Data, …):

httping with color mode. httping to an http host. httping to an https host.

dnsping

The dnsping tool out of the DNSDiag toolkit, available on GitHub, sends DNS queries. To install it, use the following commands:

git clone https://github.com/farrokhi/dnsdiag.git
cd dnsdiag/
git submodule update --init

Without any further options it sends a type A query for the hostname to the default DNS server (/etc/resolv.conf). But a few options are possible, such as the DNS server (-s SERVER) or the type of the query (-t TYPE):

weberjoh@jw-nb12:~$ cd dnsdiag/
weberjoh@jw-nb12:~/dnsdiag$ ./dnsping.py blog.webernetz.net
dnsping.py 8.8.8.8: hostname=blog.webernetz.net rdatatype=A
45 bytes from 8.8.8.8: seq=0   time=17.682 ms
44 bytes from 8.8.8.8: seq=1   time=15.788 ms
45 bytes from 8.8.8.8: seq=2   time=31.627 ms
45 bytes from 8.8.8.8: seq=3   time=32.032 ms
45 bytes from 8.8.8.8: seq=4   time=16.608 ms
45 bytes from 8.8.8.8: seq=5   time=15.957 ms
44 bytes from 8.8.8.8: seq=6   time=16.467 ms
45 bytes from 8.8.8.8: seq=7   time=32.676 ms
45 bytes from 8.8.8.8: seq=8   time=16.101 ms
45 bytes from 8.8.8.8: seq=9   time=28.697 ms

--- 8.8.8.8 dnsping statistics ---
10 requests transmitted, 10 responses received,   0% lost
min=15.788 ms, avg=22.364 ms, max=32.676 ms, stddev=7.739 ms
weberjoh@jw-nb12:~/dnsdiag$
weberjoh@jw-nb12:~/dnsdiag$ ./dnsping.py -s ns1.weberdns.de -t aaaa pa.weberdns.de
dnsping.py DNS: 2003:51:6012:110::22:53, hostname: pa.weberdns.de, rdatatype: aaaa
48 bytes from 2003:51:6012:110::22: seq=0   time=11.289 ms
48 bytes from 2003:51:6012:110::22: seq=1   time=2.408 ms
48 bytes from 2003:51:6012:110::22: seq=2   time=1.933 ms
48 bytes from 2003:51:6012:110::22: seq=3   time=1.881 ms
48 bytes from 2003:51:6012:110::22: seq=4   time=1.911 ms
48 bytes from 2003:51:6012:110::22: seq=5   time=1.859 ms
48 bytes from 2003:51:6012:110::22: seq=6   time=1.889 ms
48 bytes from 2003:51:6012:110::22: seq=7   time=1.846 ms
48 bytes from 2003:51:6012:110::22: seq=8   time=1.888 ms
48 bytes from 2003:51:6012:110::22: seq=9   time=1.867 ms

--- 2003:51:6012:110::22 dnsping statistics ---
10 requests transmitted, 10 responses received,   0% lost
min=1.846 ms, avg=2.877 ms, max=11.289 ms, stddev=2.960 ms

weberjoh@jw-nb12:~/dnsdiag$

In Wireshark, it looks like that:

dnsping Wireshark

(Note the two other tools out of the DNSDiag kit: 

dnseval.py
  and
dnstraceroute.py
 .)

smtpping

Finally, smtpping sends test mails. It defaults to “unlimited” mails, so be carefully with it and use the -c option! It is available at GitHub, too. Use the following commands to install it:

git clone https://github.com/halonsecurity/smtpping.git
cd smtpping/
cmake .
make

A sample run of four test mails is this:

./smtpping -c 4 johannes@webertest.net
, but at least the sender (empty by default) with -S should be used. -d is the debug mode:
weberjoh@jw-nb12:~$ cd smtpping/
weberjoh@jw-nb12:~/smtpping$ ./smtpping -c 4 johannes@webertest.net
PING johannes@webertest.net ([80.154.108.237]:25): 10305 bytes (SMTP DATA)
seq=1, connect=1.14 ms, helo=5.46 ms, mailfrom=7.56 ms, rcptto=9.13 ms, datasent=35.17 ms, quit=37.37 ms
seq=2, connect=1.52 ms, helo=3.55 ms, mailfrom=5.18 ms, rcptto=8.09 ms, datasent=30.68 ms, quit=35.81 ms
seq=3, connect=1.18 ms, helo=2.73 ms, mailfrom=3.86 ms, rcptto=4.92 ms, datasent=24.40 ms, quit=28.19 ms
seq=4, connect=1.34 ms, helo=5.34 ms, mailfrom=6.51 ms, rcptto=7.59 ms, datasent=38.38 ms, quit=43.11 ms

--- 80.154.108.237 SMTP ping statistics ---
4 e-mail messages transmitted
connect min/avg/max = 1.14/1.29/1.52 ms
banner min/avg/max = 1.97/2.92/4.36 ms
helo min/avg/max = 2.73/4.27/5.46 ms
mailfrom min/avg/max = 3.86/5.78/7.56 ms
rcptto min/avg/max = 4.92/7.43/9.13 ms
data min/avg/max = 5.66/8.24/9.70 ms
datasent min/avg/max = 24.40/32.16/38.38 ms
quit min/avg/max = 28.19/36.12/43.11 ms
weberjoh@jw-nb12:~/smtpping$
weberjoh@jw-nb12:~/smtpping$ ./smtpping -c 1 -S johannes@webertest.net -d johannes@webernetz.net
PING johannes@webernetz.net ([80.237.138.5]:25): 10253 bytes (SMTP DATA)
response 220 mx0.webpack.hosteurope.de ESMTP (mi005.mc1.hosteurope.de) (even more power) Wed, 04 May 2016 16:26:05 +0200
response 250 mi005.mc1.hosteurope.de Hello localhost.localdomain [80.154.108.228]
response 250 OK
response 250 Accepted
response 354 Enter message, ending with "." on a line by itself
response 250 OK id=1axxkb-00048e-GD
response 221 mi005.mc1.hosteurope.de closing connection
seq=1, connect=7.65 ms, helo=52.61 ms, mailfrom=62.02 ms, rcptto=77.89 ms, datasent=813.17 ms, quit=821.86 ms

--- 80.237.138.5 SMTP ping statistics ---
1 e-mail messages transmitted
connect min/avg/max = 7.65/7.65/7.65 ms
banner min/avg/max = 32.75/32.75/32.75 ms
helo min/avg/max = 52.61/52.61/52.61 ms
mailfrom min/avg/max = 62.02/62.02/62.02 ms
rcptto min/avg/max = 77.89/77.89/77.89 ms
data min/avg/max = 87.41/87.41/87.41 ms
datasent min/avg/max = 813.17/813.17/813.17 ms
quit min/avg/max = 821.86/821.86/821.86 ms

Here are a few screenshots from Wireshark, Cisco ESA, and Thunderbird with these test mails. Refer to the descriptions beneath the screenshots:

If no sender (-S mail@address.foo) is present, some email gateways will declare the messages as SPAM. Seen at the Cisco ESA appliance. This is how a test mail looks like in Thunderbird. Wireshark capture of smtpping: SYN, cleartext mail, FIN. Wireshark follow TCP stream 1/2. Wireshark follow TCP stream 2/2.


At the End

I am really happy with those tools. They are easy to use and can help monitoring some services while changing network or firewall settings. And they are a good argument for those security admins that still believe, that denying ping is a good security approach. Cheers!

Palo Alto Software Download Failure

$
0
0
Palo Alto disk space 01 error

I had an error on my PA-200 with PAN-OS 7.0.5 while trying to download a new firmware version. “Error: There is not enough free disk space to complete the desired operation. […]”. Even the tips to delete older software, dynamic updates, etc., and to use the “set max-num-images count” command did not lead to a successful download.

Finally, the TAC support could solve the problem via root access to the Palo Alto firewall and by manually moving data files…

This was the disk space on the firewall before the TAC support corrected it (note the 5th line with 92 % usage):

weberjoh@fd-wv-fw02> show system disk-space

Filesystem            Size  Used Avail Use% Mounted on
/dev/sda3             1.9G  1.5G  393M  79% /
/dev/sda5             6.6G  5.8G  541M  92% /opt/pancfg
/dev/sda6             1.9G  685M  1.2G  38% /opt/panrepo
tmpfs                 1.3G  116M  1.2G  10% /dev/shm
/dev/sda8             2.4G  1.9G  372M  84% /opt/panlogs

And on my monitoring server I could see that the management config partition increased its usage a few weeks ago:

Palo Alto disk space 03 Management Config Partition

The supporter now used the 

debug tac-login challenge
  and 
debug tac-login response
  commands to gain root access on my PA-200. (Interesting…) He said that the problem is due to not deleted AV- and content-packages. He then did the following steps:
  1. He navigated to the folder in which the AV and content packages reside.
  2. He moved the “newav” folder to another partition. Now there was enough disk space on the current partition.
  3. Via the GUI, he upgraded the content packages. This worked and PAN-OS correctly deleted the temporary content files.
  4. He then moved back the AV files (newav) to the original partition
  5. and upgraded the AV packages appropriately. This worked, too, and PAN-OS correctly deleted the temporary AV files, too.

Now the usage of /dev/sda5, mounted on /opt/pancfg, was about 73 %:

weberjoh@fd-wv-fw02> exitshow system disk-spacejobs allsystem disk-space

Filesystem            Size  Used Avail Use% Mounted on
/dev/sda3             1.9G  1.5G  391M  79% /
/dev/sda5             6.6G  4.6G  1.8G  73% /opt/pancfg
/dev/sda6             1.9G  685M  1.2G  38% /opt/panrepo
tmpfs                 1.3G  116M  1.2G  10% /dev/shm
/dev/sda8             2.4G  2.0G  330M  86% /opt/panlogs

This is the daily graph of the management config partition which shows the decrease of the space usage during the support call:

Palo Alto disk space 04 Management Config Partition during Support Case

After this procedure, I was able to update man PAN-OS to a newer version. Thank you. And hopefully this bug will be fixed in an upcoming version! (Bug number 94106.)

RIPE Atlas Measurements

$
0
0
RIPE Atlas Measurements - featured image

I just want to share my happiness about the RIPE Atlas measurements. If you have not heard about it yet, keep on reading. Following is a very basic overview of how the Atlas tool from the RIPE NCC can be used to test the connectivity of your own equipment.

I am hosting a RIPE Atlas Probe (Probe #19341). I am earning credits for the uptime of my hosted probe. Therefore I am able to do some user-defined measurements through other probes worldwide, such as ping, traceroute, or DNS. These measurements are configured through the GUI on the RIPE Atlas webpage. (Unluckily, the GUI is not very intuitive and has some errors. Similarly, the measurements are not always correct by default, e.g., when testing IPv6 equipment. However, over time you will learn how to use it correctly.) For more information about the Atlas program, refer to the “What is RIPE Atlas?” page.

Ping ‘n Traceroute

Here are two sample graphs that were generated after I did a one-off measurement with traceroute to my blog at http://blog.webernetz.net over IPv6 and legacy IP. (Refer to User-Defined Measurements.) The following worldwide graphs show the round-trip time (RTT) for these measurements:

IPv6 RTTs via traceroute to blog.webernetz.net. Legacy IP RTTs via traceroute to blog.webernetz.net.

The LatencyMON tab shows the ping times over time. In the following example, I am doing a ping measurement every 10 minutes to blog.webernetz.net again. The first graph shows the times for the whole last year, while the second screenshot shows the Time Travel functionality where I can travel back to every single measurement:

LatencyMON over the last year. Time Travel.

DomainMON

Another tool is the DomainMon. (More information here.) After entering a domain, the nameservers (IPv6 and IPv4) can be monitored with either UDP53, TCP53, or traceroute. I am monitoring my nameservers for my test domain “weberdns.de” with UDP53 every 3600 seconds from 10 probe in the “north-central” area, i.e., Europe. This is the graph over the last 24 hours:

DomainMon weberdns.de 24h

Of course, the other outputs such as the map or the details of probes can be displayed for this DomainMON test, too:

DomainMON DNS test map. DomainMON list of used probes.

JSON, API, etc.

These GUI tests and graphs are not the only possibility to use the RIPE Atlas. For example, the raw measurement results can be downloaded in JSON to use them within other tools. Or the RIPE Atlas API can be used to execute tests from a command line. Or have a look at the ripe-atlas-tools. However, for one-time measurements, the GUI fits quite good.

Public

Note that the test results are almost public. Each test has an unique measurement ID and the results can be seen by any web browser, such as this one from myself: https://atlas.ripe.net/measurements/3901260/ .

So be carefully in choosing the test machines. However, if only already public DMZ servers are tested, they are accessible through the Internet anyway.

Conclusion

To my mind, the RIPE Atlas program is a great tool to test the IP connectivity of own servers, either as a one-off measurement or over long time range. Furthermore, if a customer wishes to know his own reachability, RIPE Atlas can be used, too. Great.

RIPE Atlas Probe Stats

$
0
0
RIPE Atlas Probe

Since almost two years I am running a RIPE Atlas Probe in my server room. It resides in an own security zone on a Palo Alto firewall (which also powers the probe via its USB port :)). With this post I publish a few traffic statistics about the RIPE Atlas Probe.

Back in August 2014 I started the RIPE Atlas probe in my lab, of course dual-stacked (IPv6 and legacy IP) and with a 24/7 uptime. (If you are interested in how the RIPE Atlas tool can be used to test servers on the Internet, have a look at this blog post.) I am hosting Probe #19341. Here is a picture of the hardware (Twitter Tweet @2014-08-28):

Applications and Destinations

And, as always, I am interested in some statistics of it. 😉 Since the Palo Alto firewall offers a great “Application Visibility & Control” feature, it was easy to get some basic statistics about the bandwidth and application usage. The following graphs are generated over a 2-week range about all sessions that were generated by the probe. See the descriptions below the graphs:

Application Usage sorted by bytes: ssh, traceroute, dns, icmpv6, ping. Destination IPs: Many sessions to the root-servers.net. The peak on the right-hand side is a firmware upgrade from the probe. Destination Regions: Many countries all around the world and especially Europe.

Some facts (absolute values over two weeks):

  • 175 MB SSH traffic, 3 sessions (-> this is a firmware version upgrade from the probe since the destination IPv6 address has a PTR of “ctr-ams06.atlas.ripe.net”)
  • 142 MB traceroute, 307k session
  • 112 MB DNS, 260k sessions
  • 102 MB pingv6, 717k sessions
  • 50 MB pingv4, 360k sessions

Generated Traffic

My monitoring system (MRTG with Routers2) also reveals some information about the bandwidth and absolute traffic values. Here are two graphs, the monthly and the yearly one. The monthly shows a straightforward bandwidth usage of 2 kbit/s in both directions, while the yearly shows a few peaks:

Monthly graph: almost exactly at 2 kbit/s incoming and outgoing traffic. Yearly graph: just a few peaks.

The absolute values, measured with MRTG/Routers2 again, are the following (as seen from the firewall interface, i.e., “In” is coming from the probe, while “Out” is traffic to the probe):

Total over rolling last month:          In:  673.44 Mbytes   Out:  705.04 Mbytes	
95th Percentile for rolling last month: In:  2.22 kbps       Out:  2.36 kbps
Total over rolling last year:           In:  8.05 Gbytes     Out:  8.28 Gbytes	
95th Percentile for rolling last year:  In:  2.17 kbps       Out:  2.29 kbps

That is: Over one year, the probe sent 8,05 GB and received 8,28 GB to/from the Internet. In sum, it’s 16,33 GB/y = 45,81 MB/d = 1,91 MB/h = 0,54 KB/s. This is 4,34 kbit/s. Due to the RIPE Atlas FAQs (How much bandwidth will the probe consume?), “an IPv4+IPv6 probe uses approximately 6 kb/s with some user-defined measurements assigned to it.” This seems to be correct.

Reinstall your Raspberry over the Network

$
0
0
raspbian2RPi

Sometimes you want to reinstall your Raspberry Pi without switching the SD-card or via remote since it is located on another physical location. Here is a solution to reinstall the operating system remotely.

Installation

1. First you must activate the magic SysRq option:

echo 1 > /proc/sys/kernel/sysrq

This will enable the reset of the Raspberry without regular commands.

2a. Transfer the image and write it to SD:

ssh user@host "dd if=2016-05-27-raspbian-jessie.zip bs=4M" | pv | funzip | dd bs=4M of=/dev/mmcblk0

  • Login via SSH to the system on which the image is located and read it via dd. The stdout is tunneled through SSH to the local system.
  • Using pv you can see how much data is transferred. (You may need to install it with apt-get, but you can also omit this.)
  • funzip extracts the first file and sends it to stdout.
  • dd writes it to the SD-card.
 2b. You can also pull the image direct from the Internet:

curl -L http://downloads.raspberrypi.org/raspbian_lite_latest | funzip | dd bs=4M of=/dev/mmcblk0


3. Reset the Raspberry:

echo b > /proc/sysrq-trigger

Important

There are many ways how to transfer an image over the network. The methods described here pull the image from a remote location. After the transfer process has been completed, you are still logged in. With other ways, if you are logged out, you are lost because you cannot log in any more…

Be sure that you have DHCP enabled on the network.

Good luck. 😉

Links


MIDI-IF for Monotron

$
0
0
MIDI-IF for Monotron featured image 604

Juchu, endlich mal wieder ein Bastelprojekt. Für den Spielzeug-Synthesizer Monotron von Korg gibt es eine kleine Platine namens MIDI-IF, die anstelle des nicht ernsthaft zu spielenden Ribbon-Controller ein MIDI-Keyboard als Eingabequelle verwenden kann. Sprich: Man kann richtige Töne damit spielen, da man die Tasten einer Klaviatur natürlich viel besser bedienen kann als den Ribbon-Controller, bei dem man nur ungefähr die richtige Taste treffen kann. Für knapp 30,- € (inkl. Versand) und ein paar Stunden Löt- und Bastelarbeit kann man loslegen.

Zusätzlich habe ich die Schose in ein Alugehäuse gebaut und mit einer DI-Box versehen. Somit kann es direkt groß losgehen. 😉

Korg Monotron

Zum Monotron möchte ich hier gar nicht viel sagen. Ein kleiner, handlicher und analoger Synthesizer. Eine Wellenform (Sägezahn), ein LFO – wahlweise für die Tonhöhe oder das Filter, und schließlich das Filter mit Cutoff und Resonance. Man bekommt ihn für ca. 30,- € in den einschlägigen Musikläden oder als Werbegeschenk bei den bekannten Zeitschriften, die sich mit eben solchen Instrumenten auseinander setzen. 😉

Als Spielzeug dient er hervorragend! Es macht Spaß, sein Umfeld damit zu terrorisieren, den Subwoofer an seine Grenzen zu bringen, oder mit ihm zu loopen (sehr cooles Video hier, welches eigentlich zeigt dass man doch keine Klaviatur dafür braucht). Nur für den “echten” Gebrauch in einer Band oder so ist er nicht so recht geeignet, da man nicht wirklich sauber die Töne trifft. Ein Anschluss an ein MIDI-Masterkeyboard wäre die Lösung.

MIDI-IF for Monotron

Nun ist es seit langem bekannt, dass man den Monotron modden kann. Zum Beispiel wird im Workshop “Pimp dein Monotron!” auf Bonedo grob erläutert, wie man die Anschlüsse für CV und Gate nach draußen legt. Das bringt einem nicht-nur-Synthesizer-Spieler ohne Klaviatur mit diesen Ausgängen nur leider relativ wenig. Daher habe ich mich für das Bastelprojekt “MIDI-IF for Monotron” von Beatnic.jp entschieden, welches das MIDI-IN Signal in die entsprechenden Spannungen für CV und Gate wandelt.

Per Mail im Online-Shop kann man das Kit bestellen. Ca. 15,- € für das Kit plus noch mal 15,- € für den Versand nach Deutschland, welcher nur 4 Tage gedauert hat. Mit den nötigen Kenntnissen über Elektronik und etwas Erfahrung im Bereich der Löttechnik hat man das Board in 1-2 Stunden fertig aufgebaut. Da ich persönlich aber über ein paar Stolpersteine gestoßen bin, möchte ich hier noch ein paar Tipps geben:

  • R14, R15 alternativ: Ich hatte R14 erst wie im Board angezeichnet eingelötet und musste es dann wieder lösen.
  • C4 – C8 sind nicht mehr mit Bildern erklärt. Sie werden einfach eingelötet, wobei man bei den drei runden Kondensatoren (C4, C5, C8) auf die Polung achten muss: Der LÄNGERE Pin ist +.
  • Das Kabel zwischen den beiden LFO Punkten auf dem Board sieht man auf den Bildern nur sehr schlecht, da es ein grünes Kabel auf dem grünen Board ist und es auch nur kurz beschrieben wird. Es ist aber nötig. 😉

Ansonsten gab es keine größeren Probleme und die Schose lief auch direkt.

Nachgefragt

Nun war mir offensichtlich klar, dass der MIDI-IF die Signale für den Pitch CV und das Gate an den Monotron weiterreicht. Laut der Beschreibung soll man allerdings zwei weitere Kabelverbindungen zwischen den Platinen herstellen, nämlich CutOff und Vbias. Bei diesen beiden war mir nicht klar, wofür sie nötig sind, weswegen ich bei Motohiko (der Kerl hinter MIDI-IF) einfach direkt nachgefragt hatte. Hier seine Antworten:

  • Vbias: “vbias is used as the reference voltage inside of monotoron. and I use it to get in tune easy for my board. by getting this voltage, there is no need to trim pot on the board. If you can make it on your midi board ans tune it correctly then you can omits the line from monotron to midi if board. But you may need something trim pot on your new midi board.”
  • CutOff: “CV for cutoff is sweeping the cuttoff frequency with the pitch changes. if you don’t do that, you can get sound in lower tune, but getting the pitch of VCO higher then you may loose the sound. because of vco frequency may getting over the cutoff frequency of VCF. cut off frequency need to sweep with the pitch of VCO, in normally. but any of sound making may be OK. if you want it mellow when you higher pitch, then you don’t need to sweep cutoff of VCF.”

Hm, naja, so ganz kapiert habe ich es ja noch immer nicht. Egal.

Weitere Mods

Da ich nicht nur Lust an den Sounds des Monotron, sondern vor allem Spaß an der Bastelei hatte, wollte ich auch alles aus dem MIDI-IF herausholen. Zentraler Bestandteil der folgenden Mods ist dieser Schaltplan von beatnic, welcher genau zeigt, wo was zwischengelötet werden muss. Folgende Modifikationen waren noch möglich:

  • LFO-LED: Das MIDI-IF verfügt über einen eigenen LFO, welcher per MIDI in der Geschwindigkeit gesteuert werden kann und die Tonhöhe moduliert (Vibrato). Obwohl man ziemlich gut hört was er tut (sobald man das Mod-Wheel höher dreht), gibt es per se keine optische Anzeige. Aber Motohiko hat bereits vorgesorgt: Pin 3 des ICs ist mit “LED” beschriftet. Mit einem passenden Vorwiderstand (hier berechnen) kann man eine LED im Takt des LFO blinken lassen. Sehr cool. Funktioniert auch. ABER leider nur mit einem großen Nachteil: Die LED wird über die Bordspannung des Monotron versorgt. Und bei jedem Aufleuchten der LED nimmt die aktuell gespielte Tonhöhe des Monotron hörbar ab, auch wenn das Modulationsrad ganz auf Null gezogen ist. 🙁 Sehr schade. Somit ist diese LED Anzeige nicht wirklich einsetzbar. Schließlich will man nicht immerzu ein an-aus-an Vibrato haben. Workaround: Ein weiterer Kippschalter für die Status-LED. Somit kann man die LED anschalten, wenn man beispielsweise kurz die Geschwindigkeit des LFOs kontrollieren möchte. Zum ruhigen Spielen schaltet man sie dann besser wieder aus. (Ja, ich weiß, spätestens jetzt wird klar, dass es sich hier primär um ein Bastelprojekt denn um einen professionell einsetzbaren Synthesizer handelt.)
  • LFO-Speed: Die Geschwindigkeit des LFOs auf dem MIDI-IF lässt sich einfach per CC-Daten (4C bzw. 76 dezimal) steuern. Dazu muss man nur einen Regler auf dem vorhandenen MIDI-Keyboard entsprechend belegen. Ich fand aber die Variante cool, ein eigenes Poti dafür an das Board anzuschließen. Ein einfaches 10 kOhm linear Poti genügt. Auf dem oben verlinkten Schaltplan sieht man, an welche Pins das Poti muss. Ebenfalls muss der Widerstand R5 sowie der LFO enable jumper an Pin 14 des ICs angelötet werden. Nun wird der LFO nur noch über das Poti und nicht mehr über CC gesteuert.
  • LFO-Wellenform: Motohiko hatte mir in einer Mail noch diesen Tipp gegeben: “don’t for get adding switch for LFO wave shape , it’s easy. the 4th rand from the top of right side of the board named “form” get down to the ground then lfo wave shape getting to be sqr.” Das habe ich ebenfalls noch gemacht: Ein weiterer Schalter und man kann zwischen den beiden Wellenformen des LFO wechseln. 😉
  • Kammerton a’: Eine weitere coole Sache ist das Anschalten des a’ Kammertons zum besseren Stimmen des Monotrons. Sprich, man muss nicht gleichzeitig die Taste auf dem MIDI-Keyboard drücken während man mit einem Schraubenzieher am Monotron dreht. Der Ton erscheint einfach so lange, wie der Schalter aktiviert ist. So schrieb es Motohiko mir in einer Mail, wobei ich davon leider nicht alles kapiert habe. Vielleicht versteht es ja jemand von euch: “get down ‘tune’ that 3rd rand from the top of right side of the board to the ground then MIDI-IF will work as same as getting “A” from midi and put cv for “A” and put 220Hz from “440”. put it AUX of monotron then you can get 220Hz for tune.”

Gehäuse & DI-Box

Ein schönes Gehäuse für das Projekt sollte noch her. Gefunden wie immer bei Reichelt. Da aber noch genügend Platz war habe ich zusätzlich noch eine DI-Box mit ins Gehäuse gebaut. Hehe, perfekt. Somit habe ich out-of-the-box noch ein symmetrisches Signal welches direkt ans Mischpult kann. Das unsymmetrische Signal wird natürlich weiterhin durchgeschleift, so dass man einen Kopfhörer oder (Bass-) Verstärker ebenfalls direkt anschließen kann.

Bastelzeit

Hier eine Reihe von Fotos von dem Bastelprojekt, welches ja nicht nur das Löten des Boards, sondern auch ein gescheites Gehäuse inne hatte. Kommentare dazu befinden sich unterhalb der Fotos:

Kleinteile vom MIDI-IF. Das Löten ging relativ einfach gemäß dem Schaltplan. Anschlüsse der Kabel ans Monotron. Planungen für das Gehäuse. Standbohrmaschine für große Löcher ist gut! ;) Extra gekaufter Stufenbohrer, nachdem die äußeren Löcher alle versemmelt wurden. Deutlicher Unterschied zwischen Stufenbohrer (großes Loch) und normalen Bohrversuchen. Einkerbungen für Schalter. Alle Löcher fertig gebohrt. MIDI-IF ins Gehäuse einbauen. Links das fertige Modul, oben rechts die DI-Box. Fast fertig. Innenansicht mit DI-Box. FERTIG! FERTIG! Seitenansicht. Aufnahmestudio fürs YouTube Video. ;)

Bedienung

Eine Demo des fertigen MIDI-IFs mit allen zusätzlichen Modifikationen habe ich per Video aufgezeichnet. Das macht die Sache etwas audio-visueller. 😉

Ende

Das war’s. Viel Spaß beim Nachbasteln. Bei Fragen oder Lächerlichkeitserklärungen könnt ihr euch gerne per Kommentarfunktion melden.

Noch ne ADS-B Antenne

$
0
0
Noch ne ADS-B Antenne featured image 604

Nachdem meine selbst gebauten ADS-B Antennen bereits sehr gut laufen hat mich jemand auf die Idee gebracht, mal eine speziell auf diesen Frequenzbereich zugeschnittene ADS-B Antenne bei eBay zu kaufen (siehe diesen Kommentar). In der Tat ist man mit wenigen Euros bereits dabei. Ob eine solche semi-professionelle Antenne einen weiteren Empfangsbereich als meine Antenne bringt musste in einem Vergleichstest bewiesen werden.

Kurz zur Historie: Hier habe ich erklärt, wie man einen DVB-T Stick zum Empfangen von Flugzeugen verwenden kann, welchen man auch an einen Raspberry Pi anschließen kann. Mein eigener Virtual Radar Server läuft hier und wurde hier erklärt. Schließlich hatte ich hier meine eigene ADS-B Antenne gebaut.

Gekaufte Antenne

Diese Antenne habe ich nun bei eBay gekauft. Sie sieht natürlich deutlich professioneller als meine Bastelantenne aus. Hat schon was. 😉 Obgleich sie mir erst mal auseinander fiel, da das Imbus-Schräubchen zum Halt des Strahlers nicht richtig angezogen war.

Antenne im auseinandergebauten Zustand. Antenne auf dem Dach installiert. Blick aus dem Dachfenster.

Vergleich

Bevor ich die Antennen verglichen habe, hatte ich erst noch meinen Standpunkt deutlich erhöht, um endlich eine vernünftige 360° Sicht zu haben. (Ja, das Thema Blitzschutz muss ich noch beleuchten…):

Über meinen Virtual Radar Server habe ich dann den Range des Receivers “Darmstadt” über genau eine Woche aufgezeichnet und einen Screenshot davon gemacht. Gleiches dann nach dem Wechsel auf die gekaufte Antenne. Hier nun der Vergleich, jeweils in der Summer aller empfangenen Höhen (grau) sowie in den farblich markierten Höhen (bunt). Das erste Bild ist jeweils von meiner DIY-Antenne, das zweite von der eBay-Antenne:

Empfangsbereich meiner DIY Antenne. Empfangsbereich der bei eBay gekauften Antenne. DIY-Antenne colored altitudes. eBay Antenne colored altitudes.

Fazit

Also um es kurz zu machen: Ich sehe keinen Unterschied. Natürlich gibt es Abweichungen, aber längst keine gut erkennbare Vergrößerung des Empfangsbereichs. Das freut mich natürlich insofern, als dass meine selbst gebaute Antenne bereits sehr gute Dienste tut. Im Vergleich meiner DIY-Antenne zur billigen DVB-T Stabantenne war ja eine signifikante Verbesserung zu verzeichnen.

Bye Bye Maglite

$
0
0
IMG_7102 Gruppenbild nah featured image

Auch ich merke, dass ich älter werde. Mittlerweile ist es soweit, dass Technik, die “zu meiner Jugendzeit” hochaktuell war, total veraltet ist. Ein schönes und für mich trauriges Beispiel ist die Maglite. DIE Taschenlampe der Cops in den USA, welche man sogar als Schlagstock verwenden kann! Längst wurde sie durch eine high-tech LED Taschenlampe (in meinem Fall eine ThruNite) ersetzt. Hier ein paar Abschiedszeilen…

Natürlich wurde sie von einem 15 Jährigen Teenager niemals als Schlagstock verwendet. Aber es war einfach cool, nicht nur eine gute Taschenlampe, sondern quasi eine Waffe bei sich zu haben. Ich hatte natürlich auch eine Lasche zur Befestigung am Gürtel, um das schwere Teil immer bei mir zu haben. Die mega krasse Leuchtleistung hingegen hatte die Maglite auf Grund ihrer einfachen Glühlampe irgendwie nie. Sicher, sie war die beste am Markt, aber gefühlt war man immer froh, wenn man es nicht direkt beweisen musste. Der Baum in 10 Metern Entfernung war nicht wirklich total hell erleuchtet, obgleich man den Lichtkegel gut gesehen hat. Der Wow-Effekt blieb aber aus.

Ausgelaufen

Tja, was soll ich sagen? Seit vielen Jahren diente mir die Maglite nur noch als “in-den-Mund” Leuchte im Badezimmer, um bei Erkrankungen der Familienmitglieder fachmännische Ratschläge geben zu können. Dafür war sie super. Bis nach einigen Jahren die Leuchtleistung immer schlechter wurde. Ich habe mich sogar ernsthaft mit dem Gedanken beschäftigt, noch mal vier verhältnismäßig teure Mono-Zellen für meine gute alte Maglite zu kaufen. Aber dazu sollte es nicht mehr kommen: Bereits zum zweiten Mal waren die Batterien ausgelaufen. Während beim ersten Mal (vor ca. 10 Jahren) noch die Rohrzange geholfen hat (siehe Foto weiter unten), hängt dieses Mal einer der Batterien bombenfest in der Röhre. Mein Versucht, mit einer langen Spax-Schraube in die Batterie zu bohren um sie daran herauszuziehen, hat leider nicht funktioniert. Die Schraube steckt, aber rausziehen kann man die Batterie nicht:

IMG_7119 Maglite ausgelaufen

Also habe ich jetzt einen schönen und teuren Haufen Schrott bei mir stehen. Ich kann die Taschenlampe meiner Jugendzeit doch nicht einfach wegschmeißen. Aber wozu aufheben? Hm. Ich muss erst noch etwas Trauerarbeit leisten – oder bis zum nächsten Umzug warten. In jedem Fall heißt es für mich: Abschied nehmen. Bye Bye Maglite. Du wirst mir allerdings nicht fehlen.

Ersetzt

IMG_7094b Maglite und ThruNiteAuf jeden Fall musste etwas anderes her. Zumal ich für kleinere Outdoor Einsätze sowieso keine vernünftige Funzel mehr hatte. Dabei hatte ich mir zunächst die Maglite Mini LED mit 2x Mignon Zellen gekauft. Sie war schon schön zu benutzen, aber so richtig überzeugt hatte sie mich trotzdem nicht. Nach einigem Recherchieren und Interviews von Bekannten wurde es dann schließlich eine ThruNite TN12. Klein, handlich, mit speziellem Lithium-Ionen Akku (Typ 18650) und wahnsinnig hell. Der Wow-Effekt kommt bei jeder Anwendung. Auch ohne Zoom-Funktion (Fokussierung) ist es immer hell. In 5 Stufen schaltbar, klasse.

Ich will gar keine Werbung für diese eine Taschenlampe machen. Ich bin einfach nur begeistert, wie krass hell solche vernünftigen LED-Taschenlampen sind. Vor allem bei dieser Größe. Und durch die Verwendung von Akkus (anstelle von Batterien) kommen sie viel häufiger zum Einsatz, was längerfristig dafür sorgt, dass keine unbenutzten Batterien auslaufen werden.

Immer dabei

Genial ist zudem die Tatsache, dass man die deutlich kleineren Taschenlampen immer dabei haben kann. Vor einigen Wochen war ich auf dem Willow Creek Leitungskongress in Hannover. Ich hatte natürlich meine ThruNite dabei. Auch wenn ich sie nicht wirklich gebraucht hatte, kam sie bei einer Art “Umfrage” gut zum Einsatz, wo alle Personen in der Arena mit ihren Handytaschenlampen leuchten sollten. Neben ein paar anderen Besuchern stach meine Funzel dabei klar heraus (Source: Tweet):

Willow Creek Leitungskongress 2016 Taschenlampe

So etwas macht mir einfach tierisch Spaß. 😉

Billiger

Noch krasser sind ja die No-Name CREE LED Taschenlampen, wie dieser hier bei Amazon für 2,95 € inkl. Versand. Wahnsinn. Stabiles Gehäuse, einfach 1x Mignon Zelle rein und man hat viel Licht. Besser als jedes Werbegeschenk. Auch für die Kids unkaputtbar. Und das für den Preis? Respekt. Ich habe direkt mal 10 Stück gekauft und nutze sie als Standard-Geschenk für Kleinigkeiten. Oder um in wirklich jedem Rucksack/Tasche/Auto/Büro eine Lampe dabei zu haben. Kann ich nur empfehlen. (Obwohl natürlich kein Vergleich zur ThruNite, welche deutlich heller ist! Aber Preis-Leistung stehen in einem sehr guten Verhältnis.)

Hier noch zwei Bilder von den Funzeln. Von links nach rechts: Maglite 4x D, Maglite Mini Glühlampe, Maglite Mini LED, ThruNite TN12, No-Name CREE LED:

IMG_7102 Gruppenbild nah IMG_7111 Kleine Taschenlampen von vorne

Bei der ThruNite Taschenlampe (vorletzte) sieht man deutlich, wie gut der Spiegel ausgerichtet ist. Obwohl ich schräg reinfotografiert habe, ist im Reflektor nur die LED zu sehen.

Ich bin happy mit den LED-Taschenlampen. Wie gut, dass ich älter geworden bin.

Palo Alto IPv4 vs. IPv6 Performance Speedtests

$
0
0
Palo IPv4 vs IPv6 featured image

After I have done some speedtests on the FortiGate firewall I was interested in doing the same tests on a Palo Alto. That is: What are the throughput differences of IPv4 vs. IPv6, measured with and without security profiles, i.e., with and without threat prevention.

It turned out that the throughput is much higher than the official information from Palo Alto. Furthermore, I was not able to test the threat prevention at all, because non of my traffic (Iperf and mere HTTP) went through the antivirus engines. I have to test this again. However, here are the measured values so far:

Laboratory & Scenarios

I had a single PA-200 with PAN-OS 7.1.1 installed. The two test notebooks ran Knoppix 7.6.1 and Iperf version 2.0.5. This time I only used the TCP test. For the HTTP tests I used an Apache2 webserver on the one side and wget on the other side.

I tested the following scenarios, all of them routed through the Palo Alto:

  1. Iperf, single policy rule, NO security profiles, both directions. This was recognized as “unknown-tcp” though the application “iperf” exists. (Refer to Applipedia.)
  2. Iperf, with security profiles, still recognized as unknown-tcp, both directions.
  3. Iperf, with security profiles and app-override, now displayed as “iperf”, both directions.
  4. HTTP, with security profiles, recognized as “web-browsing”, only server to client direction, but with enabled server response inspection.

Here are a few screenshots of the policies and the traffic log:

Security Policy without Security Profiles Security Policy WITH Security Profiles Security Policy WITH Security Profiles Traffic Log without Security Profiles unknown-tcp Traffic Log WITH Security Profiles http wget

And a listing from one wget HTTP test:

root@Microknoppix:~# wget http://[2003:51:6012:171:221:70ff:fee9:bb47]/1G-file
--2016-05-06 11:14:49--  http://[2003:51:6012:171:221:70ff:fee9:bb47]/1G-file
Verbindungsaufbau zu [2003:51:6012:171:221:70ff:fee9:bb47]:80 … verbunden.
HTTP-Anforderung gesendet, auf Antwort wird gewartet … 200 OK
Länge: 1048576069 (1000M)
Wird in »»1G-file.1«« gespeichert.

1G-file.1                     100%[=================================================>]   1000M  88,1MB/s    in 11s

2016-05-06 11:15:01 (87,7 MB/s) - »»1G-file.1«« gespeichert [1048576069/1048576069]

Results

These are the test results:

All measured values are almost around 930 Mbps, except the Apache/wget/HTTP traffic. I suppose that this comes from other parameters such as the Apache server, the local file reading/writing, or wget.

For the sake of completeness, these are the raw values, each with Tx/Rx in Mbps:

  • Iperf without security profiles, unknown-tcp: IPv4 = 940/934, IPv6 = 926/921
  • Iperf with security profiles, unknown-tcp: IPv4 = 939/934, IPv6 = 926/921
  • Iperf with security profiles and app override -> iperf: IPv4 = 942/936, IPv6 = 929/923
  • HTTP with security profiles, web-browsing, single direction: IPv4 = 774, IPv6 = 704

Conclusion

Ok, this is really strange! Palo Alto lists a firewall throughput for the PA-200 of 100 Mbps and a threat prevention throughput of 50 Mbps. My tested results are way beyond that.

Much better compared to the results from the FortiGate are the “v4 vs. v6” differences. Both protocols are almost at the same speed.

Concerning the security profiles: As long as the application is not recognized correctly (and only shown as unknown-tcp), the threat prevention will not work. That’s ok. Similar to the app override, refer to this PAN documentation: “An application override with a custom application will prevent the session from being processed by the App-ID engine, which is a Layer-7 inspection.” But why is the threat prevention not working for the web-browsing traffic? The throughput should dramatically decrease when the whole traffic is scanned for viruses, etc., shouldn’t it?

Palo Alto VPN Speedtests

$
0
0
Palo Alto VPN Speedtests featured image

Once more some throughput tests, this time the Palo Alto Networks firewalls site-to-site IPsec VPN. Similar to my VPN speedtests for the FortiGate firewall, I set up a small lab with two PA-200 firewalls and tested the bandwidth of different IPsec phase 2 algorithms. Compared to the official data sheet information from Palo Alto that state an IPsec VPN throughput of 50 Mbps, the results are really astonishing.

Lab

My lab consists of two PA-200 firewalls with PAN-OS 7.1.1 installed. They were plugged into a simple layer 2 switch. The two notebooks were booted with Knoppix 7.6.1 and used Iperf version 2.0.5.

Palo Alto VPN Speedtests Labor

I first tested the throughput with only routing and then built the VPN. After every test I changed the phase 2 parameters. The Iperf tests ran in both directions. Here are some configuration screenshots:

IKE Gateway Ike Gateway Advanced IPsec Tunnel Traffic Log with different Zones

Of course I verified the correct IPsec algorithms after each change, such as here:

weberjoh@fd-wv-fw02> show vpn ipsec-sa tunnel VPN-Test

GwID/client IP  TnID   Peer-Address           Tunnel(Gateway)                                Algorithm          SPI(in)  SPI(out) life(Sec/KB)
--------------  ----   ------------           ---------------                                ---------          -------  -------- ------------
20              24     80.154.108.226         VPN-Test(VPN-Test)                             ESP/3DES/SHA1      9AA65C85 D49DF3F6 3481/0

Show IPSec SA: Total 8 tunnels found. 1 ipsec sa found.


Test Results

Here are the results, each Tx/Rx in Mbps:

And the raw values:

  • Only routing: 937/934
  • esp-3des-sha1-group2-1h: 198/228
  • esp-aes128-sha1-group5-1h: 215/271
  • esp-aes256-sha256-group14-1h: 205/254
  • esp-aes256-sha512-group20-1h: 212/260

That is: All tests are around 200 Mbps. The Tx direction is always a bit slower, which might be a test failure. The AES algorithms are faster than the old 3DES cipher. This might be related to the fact that AES is made to be fast in software and in hardware.

Conclusion

Wow, these are really high values. The data sheet talks about 50 Mbps, even for the bigger PA-500 firewall. I don’t know why, but my test results are four times greater than the official notes. Ok, I can live with that. 😉

Fortinet Feature Requests

$
0
0
Fortinet Feature Requests featured image

I really like the FortiGate firewalls. They are easy to manage and have lots of functionality. However, I am also aware of some other firewall products and therefore have some feature requests to Fortinet that are not currently implemented in their firewalls. I am sometimes forwarding these FRs to the Fortinet support or to an SE, but they are not really interested in that. ;( So here is a list of my ideas that could improve the firewall. Hopefully/maybe some of them will be implemented one day…

This is a living list. I’ll update it every time I discover something new.

  • [IPv6] One single policy rule set for both protocols (IPv4 and IPv6), not different policies. (Really a major design flaw!)
  • [MGMT] I want to be able to ping the wan interface from any without allowing ssh access from any, too. Currently, if I am allowing an administrator to come from ::0/0 (or 0.0.0.0/0), both, ping and ssh (etc.) are allowed.
  • [MGMT] Configuration Revisions: It would be great to have a list of the last x full-configurations or configuration steps that were done on the firewall. Even better, a compare feature between two configurations, e.g., the one from yesterday compared to the one from last week.
  • [VPN] There is no way to find out the actual used Diffie-Hellman groups for either phase 1 of IKE or phase 2 (PFS) of IPsec. The only way to find out which proposal is chosen, the tunnel must be set “down” while capturing the IKE/IPsec packets on the CLI. There should be a “get …” command that shows not only the used symmetric ciphers and algorithms, but also the used DH groups.
  • [USER] The great two-factor authentication, e.g., via SMS, is only working for users with their phone number configured locally on the FortiGate. This feature is not available for users within LDAP groups, even though their numbers are present at the AD. That is, if the 2FA features must be used, every (!) user must be created locally on the FortiGate, too.
  • [GUI] IPv6 settings through the GUI, e.g., router advertisements, DHCPv6, OSPFv6. Currently, only the mere IPv6 address can be entered.
  • [GUI] Fields for more than one Syslog server.
  • [GUI] The Log Config -> Alert E-mail page is only visible if an SMTP server is specified under System -> Config -> Advanced. This is really confusing when searching after the alert email settings.
  • [GUI] The Security Log should be visible anytime, not only after security events. It is confusing that it is hidden by default.
  • [GUI] It is great to “select columns to display” within the policies. However, after each logout the columns are set to its default values. Why?
  • [GUI] Missing option within the user definition to “Enable Two-factor Authentication” for SMS. This must be done via the CLI. You can configure a SMS number but not enable it for two-factor authentication. Where is the sense?

GUI, GUI, GUI

One of my main problems with FortiGate is the GUI. There are so many features that are not accessible through the GUI. (Even though everything is enabled within System -> Config -> Features.) Some really good technical persons might be able to configure everything through the CLI, but I am selling firewalls to “normal” IT guys that also manage Windows AD, AV, APT, MDM, routers, mail, DNS, end users, etc. Everything that’s not included in the GUI is simply not present.

Fortinet, why aren’t you improving your GUI?

FortiGate Application Traffic Shaping

$
0
0
FortiGate Application Traffic Shaping featured image

This is a really cool and easy to use feature of the FortiGate firewall: the traffic shaper. Once an application category uses too much traffic, the bandwidth consumption can be decreased with it. Just about three clicks:

In my case, a customer had an ISP connection of 20 Mbps. Sometimes, the replication of Lotus Notes takes all of this bandwidth which results in packet delay for all other sessions. We decided to limit the “collaboration” application category to a max bandwidth of 10 M. Immediately, the ISP connection was not slowed down anymore.

The following screenshots show how to configure a traffic shaper and how to use it on an application category. The third screenshots shows the overall bandwidth (interface history of wan1) which dropped from 20 to 10 Mbps. Perfect.

Traffic Shaper Application Control Result from 20 to 10 MBits

Using NetFlow with nProbe for ntopng

$
0
0
nProbe ntopng featured image

This blog post is about using NetFlow for sending network traffic statistics to an nProbe collector which forwards the flows to the network analyzer ntopng. It refers to my blog post about installing ntopng on a Linux machine. I am sending the NetFlow packets from a Palo Alto Networks firewall.

My current ntopng installation uses a dedicated monitoring ethernet port (mirror port) in order to “see” everything that happens in that net. This has the major disadvantage that it only gets packets from directly connected layer 2 networks and vlans. NetFlow on the other hand can be used to send traffic statistics from different locations to a NetFlow flow collector, in this case to the tool nProbe. This single flow collector can receive flows from different subnets and routers/firewalls and even VPN tunnel interfaces, etc. However, it turned out that the “real-time” functionalities of NetFlow are limited since it only refreshes flows every few seconds/bytes, but does not give a real-time look at the network. It should be used only for statistics but not for real-time troubleshooting.

Some Pre Notes

I am using a Ubuntu 14.04.5 LTS (GNU/Linux 3.16.0-77-generic x86_64) server. At the time of writing, nProbe had version v.7.4.160802 while ntopng was in version v.2.4.160802. Furthermore note that nProbe requires a license.

For general information about NetFlow use Wikipedia or Cisco or RFC 3954. For the other tools, use the official web sites: nProbe and ntopng. The nProbe site offers a detailed documentation PDF. A similar tutorial for installing nProbe is this one.

Installation of nProbe

(Since I already showed how to install ntopng, I will only show how to use nProbe here.) The stable builds for nProbe and ntopng are listed here. That is, to install nProbe, I used the following commands:

wget http://apt-stable.ntop.org/14.04/all/apt-ntop-stable.deb
sudo dpkg -i apt-ntop-stable.deb
sudo apt-get update

sudo apt-get install nprobe

Since I want to receive NetFlow packets and forward them to ntopng, nProbe must run in Collector Mode. That is, I am using the following configuration file:

sudo nano /etc/nprobe/nprobe-none.conf

with these entries:

--zmq="tcp://*:5556"
--collector-port=2055
-n=none
-i=none

Note the naming of the config file: “nprobe-none.conf“. This is mandatory due to the documentation of nProbe: “When nProbe is used in probe mode it is not bound to any interface as its job is to collect NetFlow from some other device. In this case the configuration file to be created is: nprobe-none.conf.” (To my mind, this is a spelling mistake because it should read “When nProbe is NOT used in probe mode…”. However, it is working.)

Furthermore, an empty “start” file is needed to tell the init process to use this configuration file:

sudo touch /etc/nprobe/nprobe-none.start

After a start of the service with

sudo service nprobe start
, ntopng must be configured to use this nProbe instance. Open the configuration file:
sudo nano /etc/ntopng/ntopng.conf

and add the following interface (= localhost):

--interface="tcp://127.0.0.1:5556"

Finally, restart the ntopng process:

sudo service ntopng restart
.

A netstat view should indicate the listening 2055 UDP port for nProbe, the 5556 TCP port for the connection between nProbe and ntopng, as well as the common 3000 TCP port from the ntopng WebGUI:

weberjoh@jw-nb10-syslog-mirror:~$ sudo netstat -tulpen
Active Internet connections (only servers)
Proto Recv-Q Send-Q Local Address           Foreign Address         State       User       Inode       PID/Program name
tcp        0      0 127.0.0.1:6379          0.0.0.0:*               LISTEN      107        12714       1184/redis-server 1
tcp        0      0 0.0.0.0:5556            0.0.0.0:*               LISTEN      0          15260       1641/nprobe
tcp        0      0 0.0.0.0:22              0.0.0.0:*               LISTEN      0          12157       1017/sshd
tcp        0      0 0.0.0.0:3000            0.0.0.0:*               LISTEN      65534      14983       1676/ntopng
tcp6       0      0 :::22                   :::*                    LISTEN      0          12159       1017/sshd
udp        0      0 0.0.0.0:2055            0.0.0.0:*                           0          15261       1641/nprobe
udp        0      0 192.168.120.10:123      0.0.0.0:*                           0          14413       1526/ntpd
udp        0      0 127.0.0.1:123           0.0.0.0:*                           0          14412       1526/ntpd
udp        0      0 0.0.0.0:123             0.0.0.0:*                           0          14405       1526/ntpd
udp        0      0 0.0.0.0:161             0.0.0.0:*                           0          12958       1224/snmpd
udp        0      0 0.0.0.0:514             0.0.0.0:*                           0          12684       1157/syslog-ng
udp        0      0 0.0.0.0:55059           0.0.0.0:*                           0          12943       1224/snmpd
udp6       0      0 :::2055                 :::*                                0          15262       1641/nprobe
udp6       0      0 2003:51:6012:120::1:123 :::*                                0          14416       1526/ntpd
udp6       0      0 fe80::21d:92ff:fe53:123 :::*                                0          14415       1526/ntpd
udp6       0      0 ::1:123                 :::*                                0          14414       1526/ntpd
udp6       0      0 :::123                  :::*                                0          14406       1526/ntpd
udp6       0      0 ::1:161                 :::*                                0          12959       1224/snmpd

Since all services are now configured within configuration files that are referenced in the init scripts, they are started automatically after a system reboot. Great.

Palo Alto NetFlow

I am using a Palo Alto Networks firewall (version 7.1.3) to send NetFlow statistics to the nProbe collector. (More information about NetFlow on Palo.) This is configured in the following way: Adding of a NetFlow Server Profile and referencing this profile on all needed Network Interfaces, such as:

New NetFlow Server Profile. Referenced in some (or all) Network Interfaces. Indicated by these icons at the summary page.

I am using quite fast values for the Template Refresh Rate as well as the Active Timeout. On interfaces with huge amount of traffic other values are probably better.

A small tcpdump capture shows some samples of the NetFlow packets sent by the Palo Alto. The following Wireshark screenshots show a NetFlow template as well as a sample flow:

NetFlow Template 258. Sample flow using template 258: SMTP between two IPv6 host using 27 packets.

ntopng Usage

Now here is the usage within ntopng. Simply choose the tcp://127.0.0.1:5556 interface at the upper right side. All features of ntopng remain the same, such as using the Dashboard, the Flows or the Hosts pages. (Refer to my post to see some features.)

Choosing the nProbe interface. Using ntopng as normal.

However, here comes the problem with NetFlow: It is NOT a real-time application that lets ntopng show every single flow and its bandwidth correctly. It can be used to see a rough view of all flows during the past few seconds, but not its actual throughput at the moment.

Refer to the following two dashboard screenshots from ntopng. The first shows the Realtime Top Application Traffic from the NetFlow probe, while the second one shows the same from the mirror port eth1. The 54 MBit/s peak in the first screenshot is not true at all. In fact, it was a constant download over a few minutes. Whereas the second screenshot from eth1 shows the correct real-time bandwidth usage.

Peak from nProbe not correct on this time basis. Real-time view of a mirror port are correct.

Conclusion

nProbe for ntopng can be used quite easily. It is possible to receive flows from different locations which can be displayed in a single instance of ntopng. However, if the primary goal is to have a real-time look at the network, e.g., which hosts or flows are consuming bandwidth, this approach does not fit. NetFlow data must be used with statistical applications that can report traffic stats, but not with real-time analyzers such as ntopng.

CPU Usage Increase FortiGate 100D -> 90D

$
0
0
CPU Usage FortiGate 100D - 90D featured image

A few weeks ago I swapped a FortiGate 100D firewall to a 90D firewall. The 100D was defective and needed to be replaced. Since the customer only has a 20 Mbps ISP connection, I thought that a FortiGate 90D would fit for the moment, since it has a firewall throughput of 3,5 Gbps, compared to the lower value of 2,5 Gbps from the 100D.

Indeed, it worked. However, the CPU usage increase was huge, almost related to the NGFW throughput. Here are some graphs:

I migrated exactly the same configuration from the 100D to the 90D. Both devices running software version 5.2.7. There are about 100 devices surfing in the web. Around 10 VPN connections, and as already noted, only 20 Mbps to the Internet. Here are the graphs for CPU, connections, and wan1 usage over the last few weeks. Obviously, neither the connections nor the wan1 usage increased, but the CPU is almost always peaking at 100 % during working time. Even the average usage is about 50-70 %. (And even though only 10 Mbps are used!):

FortiGate 100D and 90D: CPU. FortiGate 100D and 90D: Connections. FortiGate 100D and 90D: wan1.

A look at the CLI (which is only a short time snapshot) looks like that:

FortiGate-90D # diagnose sys top-summary
   PID      RSS  ^CPU% MEM%   FDS     TIME+  NAME
 * 79       27M   44.3  1.5    15  17:18.77  reportd
   90       29M   22.3  1.6    15  00:04.99  sshd [x4]
   65      105M   12.4  5.7    46  00:15.90  ipsmonitor [x3]
   78       63M   11.3  3.5    14  51:24.34  sqldb
   479      44M    7.1  2.4  2259  55:50.97  proxyd [x3]
   62       23M    2.3  1.3    16  00:26.64  httpsd [x4]
   481      30M    0.4  1.7    20  08:50.22  urlfilter
   482      10M    0.0  0.6    14  00:00.20  ovrd
   485      14M    0.0  0.8    14  00:06.65  dsd
   287      10M    0.0  0.6    12  00:01.57  radvd
   38       24M    0.0  1.3    13  07:36.66  cmdbsvr
   296      14M    0.0  0.8    29  12:00.68  iked
   480      40M    0.0  2.2    31  04:37.14  scanunitd [x3]
   171      10M    0.0  0.6     8  00:00.00  getty
   2479     43M    0.0  2.4    12  00:31.70  pyfcgid [x4]
   48       11M    0.0  0.6    87  00:05.59  zebos_launcher [x12]
   59       10M    0.0  0.6    12  00:00.49  uploadd
   60       33M    0.0  1.8    55  28:54.36  miglogd [x2]
   61       10M    0.0  0.6     8  00:01.10  kmiglogd
   68       10M    0.0  0.6    11  00:11.12  merged_daemons
   CPU [|||||||||||||||||||||||||||||||||||     ]  89.0%
   Mem [||||||||||||||||||||||                  ]  56.0%  1045M/1834M
   Processes: 20 (running=1 sleeping=86)

I even had some situations, in which I got an “Error 500: Internal Server Error” when trying to change some address objects. Is this normal? Until the defective FortiGate 100D firewall (which ONLY showed such errors due to a hard disk error), I did not see these:

CPU Usage FortiGate 100D - 90D 04 Address Object Error

–> After a second look at the Fortinet Product Matrix, I gathered the big difference: While the FortiGate 100D has a “NGFW Throughput” of 210 Mbps, the 90D only has 25 Mbps! That is, I am not surprised anymore. 😉

And I learned something (again) today: It does NOT depend on the “Firewall Throughput”, but on the IPS/SSL/Application/NFGW/Threat Throughput!

ownCloud Data Directory

$
0
0
ownCloud Data Directory

I initially stored my ownCloud data on an external NTFS hard disk. (Yes, this was not a good idea at all.) After some time now I wanted to move the files to a bigger ext4 drive on the same machine. Unluckily there are many posts and articles that are really irritating on the Internet, such as: 1, 2, 3, 4, 5. At least I found some promising hints at the official GitHub forums (this and that) and gave it a try:

At many points, someone noted that it is not officially supported to move the data directory after installation. 🙁 However, the just linked GitHub pages are talking about a method. I tried to copy (cp) all of my files, but ran into some hard disk errors due to broken USB connections on my server. After I tried it again (cp -u), I finally used rsync to copy all of my files, incl. the hidden files that were not copied with cp. These were my steps:

Copy

I first enabled the maintenance mode:

sudo -u www-data php occ maintenance:mode --on

and began to copy my data files (500 GB) from one mount to another. (NOTE: You should skip these steps and use rsync directly, such as explained in a few seconds):

sudo -u www-data cp -r /mnt/ExterneHDD/* /mnt/1TB-VM

But since I ran into some hard disk errors, I used cp again with the -u option to “update” all files:

sudo -u www-data cp -r -u /mnt/ExterneHDD/* /mnt/1TB-VM

After that I set the correct file ownership to www-data:

sudo chown -R www-data:www-data /mnt/1TB-VM

While I was still confused whether all files were copied, I noticed that at least the hidden files such as .htaccess were NOT present at the new file location. A colleague gave me the hint to use rsync, which I tried thereafter. (Refer to here and there.) I first ran the demo mode from rsync. Additionally I set the -P option for progress information and the –stats for final statistics. Also note the critical slashes at both paths. While the first one ends with a slash, the second doesn’t:

sudo rsync -avPn --stats /mnt/ExterneHDD/ /mnt/1TB-VM

(Since I copied from an NTFS hard disk, I also used the –size-only option to compare only the sizes of the files and not the ownership.)

Finally, I ran the following command to copy all broken files which were not copied correctly during my cp runs:

sudo rsync -avP --stats /mnt/ExterneHDD/ /mnt/1TB-VM

Yep, it worked. Great so far.

And ownCloud Changes

Now I changed the “datadirectory” path within the config.php file:

sudo nano /var/www/owncloud/config/config.php

to point to the new mounted drive:

'datadirectory' => '/mnt/1TB-VM/',

And I ran the repair command that was mentioned in the GitHub post:

sudo -u www-data php occ maintenance:repair

This looked like the following (and executed quite fast!):

root@jw-vm12:/var/www/owncloud# sudo -u www-data php occ maintenance:repair
ownCloud is in maintenance mode - no app have been loaded
 - Repair mime types
 - Repair legacy storages
 - Clear asset cache after upgrade
     - Asset pipeline disabled -> nothing to do
 - Generate ETags for file where no ETag is present.
     - ETags have been fixed for 0 files/folders.
 - Clean tags and favorites
     - 0 tags for delete files have been removed.
     - 0 tag entries for deleted tags have been removed.
     - 0 tags with no entries have been removed.
 - Drop old database tables
 - Drop old background jobs
 - Remove getetag entries in properties table
     - Removed 0 unneeded "{DAV:}getetag" entries from properties table.
 - Repair outdated OCS IDs
 - Repair invalid shares
 - Fix permissions so avatars can be stored again
 - Manually copies the third-party folder changes since 9.0.0 due to a bug in the updater.
     - Third-party files seem already to have been copied. No repair necessary.
     - Rechecking code integrity not necessary.

Yeah, after some breathing space I disabled the maintenance mode:

sudo -u www-data php occ maintenance:mode --off

And I was REALLY HAPPY that everything worked again. YEAH! (Though I am still a bit nervous because of this post which talks about some absolute paths within logrotate. I have never used this or heard about it concerning ownCloud. Hopefully, this won’t break my data after a few weeks…)

Wie man als arbeitender Familienvater 399 € Elterngeld bekommt

$
0
0
Elterngeld featured image 2

Unser erstes Kind kam während des Studiums. Sprich: Elternzeit konnte ich mir keine nehmen (oder ich hätte ein ganzes Semester verlängern müssen) und fürs Elterngeld gab es immerhin den Mindestsatz von 300,- €/Monat. Gut geplant kam also das zweite Kind zu einem Zeitpunkt, an dem ich bereits einige Monate voll verdienend unterwegs war. Entsprechend höher erwarteten wir auch das Elterngeld. Schock und große Ärgernis dann aber, als ich auch dieses mal lediglich den Mindestsatz bekommen sollte, da die Berechnung des Elterngeldes nicht meinen richtigen Job, sondern meinen Nebenjob während es Studiums als Grundlage nahm. Arg! Was sollte das denn???

Mittlerweile ist das schon eine Weile her, so dass ich relativ lässig darüber schreiben kann. Zu dem damaligen Zeitpunkt hatte es mich aber sehr sehr geärgert und aufgeregt. Hier also ein paar Hinweise dazu, was man als Berufsanfänger beachten muss (bzw. worauf man gefasst sein muss), wenn man fest mit Elterngeld plant:

Ungünstige Elterngeldberechnung

Im Jahr 2012 war ich komplett Student und hatte neben meinem BAföG noch einen Nebenjob. Im April 2013 fing ich als Arbeitnehmer richtig an zu arbeiten. Im September 2013 kam unser Kind. Die normale Berechnung des Elterngeldes sieht vor, die 12 Monate vor Geburt des Kindes als Grundlage zu nehmen, wovon man 2/3 des Nettogehalts monatlich bekommen soll. Bei mir wären innerhalb der letzten 12 Monate also immerhin 5 volle Monate (April bis August 2013) komplett verdient mit in der Rechnung gewesen.

Anfang 2013 meldete ich zusätzlich ein Gewerbe (Nebenerwerb) bei der Stadt an. Soweit, sogut. Jetzt kam aber das Problem: Sobald man ein Gewerbe hat, wird für die Berechnung des Elterngeldes das vorherige Kalenderjahr (!) verwendet und nicht mehr die 12 Monate vor Geburt. In meinem Fall wurde somit das Jahr 2012 herangezogen, in dem ich wie gesagt lediglich BAföG Empfänger war und einen kleinen Nebenjob hatte. Somit wird schnell klar: Über die 300,- € Mindestsatz kam ich nur minimal hinaus. Immerhin wurden mir die 75,- € zusätzlich für das zweite Kind nicht genommen. Deutlich weniger als die erwarteten 2/3 des Nettogehalts war es allemal.

Hier mal als Grafik. Man sieht relativ gut, dass die Berechnung des Elterngeldes (orange) voll auf den Bereich meines Studiums (blau) fällt, obwohl ich ab April 2013 (grün) bereits gearbeitet hatte. Mit den 12 Monaten vor Geburt (gelb) hätte ich gut leben können. In hellblau sind die beiden Elternzeitmonate zu erkennen:

Grafik Elterngeldberechnung 2013

Telefonate und Widerspruch

Nun, so direkt wollte ich das nicht auf mir sitzen lassen. Also rief ich beim “Hessischen Amt für Versorgung und Soziales” an und ließ mich nach einer ersten Diskussion mit der Abteilungsleitung verbinden. Diese sagte mir, dass die Regelung des Elterngeldes klar im Gesetzestext hinterlegt ist. “Wäre es nur in den Richtlinien, könnte es ein Richter anders auslegen.” In meinem Fall ist es aber klare Sache. Die Abteilungsleiterin sagte auch, dass es ihr echt Leid tut und sie natürlich sieht, dass die Summe des Elterngeldes bei mir nicht realistisch zu meinem eigentlichen Gehalt ist, sie aber auch nichts tun kann. Einen Härtefall oder vergleichbares sieht das Elterngeld ebenfalls nicht vor. Ironisch lustig war auch der Kommentar, dass ich die Elternzeit ja auch einfach sein lassen könnte, zumal mein erster Elternmonat ja bereits bei Erhalt des Elterngeldbescheides vorbei war.

(Unter anderem kann diese Regelung für andere Fälle auch sehr positive Auswirkungen haben, beispielsweise: Mutter von dritten Kind hat ein Nebengewerbe immer nebenbei laufen lassen. Jetzt erfolgt die Berechnung mit Ausfallzeiträumen, wodurch ihr Elterngeld aber von VOR dem ersten Kind berechnet wird, was deutlich mehr ist, als wenn es die 12 Monate vor Geburt des dritten Kindes gewesen wären. Naja, toll, bringt mir aber nichts.)

Der Vollständigkeit halber habe ich dann noch schriftlichen Widerspruch eingelegt. Ich legte dar, dass es ja offensichtlich ist, dass die 300,- € nicht 2/3 meines Nettogehalts entsprechen. Und wenn zur Berechnung des Elterngeldes schon mein Jahr des Studiums herangezogen wird, dann soll wenigstens auch mein Stipendium und mein BAföG hinzugezogen werden, und nicht nur mein lächerlicher Nebenjob.

Der Widerspruch wurde erwartungsgemäß zurückgewiesen.

“Abweichend hiervon ist für die Ermittlung des Einkommens aus nichtselbstständiger Erwerbstätigkeit vor der Geburt der steuerliche Veranlagungszeitraum maßgeblich, der den Gewinnermittlungszeiträumen nach § 2b Abs. 2 BEEG zugrunde liegt, wenn die berechtigte Person im Bemessungszeitraum Einkommen aus selbstständiger Erwebstätigkeit hatte.”

“Eine Berücksichtigung der von im Rahmen des Widerspruchsverfahrens geltend gemachten Einkünfte

  • steuerfreies Stipendium
  • BAföG
  • Elterngeld für das erste Kind

sieht das Gesetz nicht vor.”

Tja. Dumm gelaufen. Und für uns in der Situation damals (zwei Kinder und noch ordentlich BAföG Schulden im Nacken) alles andere als lustig. Schließlich war ich der Meinung, dass es eher gut ist, Kinder zu bekommen, außerdem noch mehr als eins und das sogar in jungen Jahren.

Ich finde es gut, dass es Elternzeit und Elterngeld gibt. Mich hat der Staat mit seinen guten Ideen leider gleich zweimal fies getroffen: Beim ersten Kind war ich Student und konnte keine Elternzeit nehmen, beim zweiten Kind war ich endlich normaler Arbeitnehmer, aber mein Elterngeld wurde mir quasi verweigert. Na toll!

(By the way: Den zweiten Elternzeitmonat habe ich im 9. Lebensmonat des Kindes genommen. Zu diesem Zeitpunkt war ich also über ein Jahr Arbeitnehmer. Da das Elterngeld aber das gleiche bleibt, habe ich auch in meinem zweiten Elternzeitmonat nur etwas über 300,- € Elterngeld bekommen.)

Fazit

Wir haben uns trotzdem dafür entschieden, Elternzeit zu machen. Sogar zwei mal einen ganzen Monat. Auf die nächsten Jahre gerechnet war es uns dann doch deutlich wichtiger, Zeit mit der jungen Familie zu verbringen, als auf ein paar Hundert Euro zu achten. Die Wut im Bauch ist mittlerweile auch gewichen. Etwas veräppelt fühle ich mich aber nach wie vor.

Ich hoffe, dass bei der Recherche nach Elterngeld für Berufsanfänger jemand auf diesen Text hier stößt und sich somit zumindest etwas besser darauf vorbereiten kann. Vor allem natürlich frische (Studiums-) Absolventen, welche genau in die gleiche Falle laufen könnten wie ich. Viel Erfolg.

© Titelbild by Mareike Weber – Weberwelten

Palo Alto FQDN Objects

$
0
0
Palo Alto FQDN Objects featured image

While I tested the FQDN objects with a Palo Alto Networks firewall, I ran into some strange behaviours which I could not reproduce, but have documented them. I furthermore tested the usage of FQDN objects with more than 32 IP addresses, which are the maximum that are supported due to the official Palo Alto documentation. Here we go:

Some Notes

I am using a Palo Alto PA-200 with PAN-OS 7.1.4-h2. A description of how to use the FQDN objects by Palo Alto Networks is this “How to Configure and Test FQDN Objects” article. To show and refresh them via the CLI, these commands can be used (refer to my list of CLI troubleshooting commands):

request system fqdn show
request system fqdn refresh

Note that at least one policy must use an FQDN object to be queried by the firewall. Otherwise, it won’t be resolved at all.

The release notes from PAN-OS 7.1 state: “Issue ID 98576: In PAN-OS 7.1 and later releases, the maximum number of address objects you can resolve for an FQDN is increased from 10 of each address type (IPv4 and IPv6) to a maximum of 32 each. However, the combination of IPv4 and IPv6 addresses cannot exceed 512B; if it does, addresses that are not included in the first 512B are dropped and not resolved.”

In oder to test different scenarios, I generated the following FQDNs on my DNS server. The names are almost self-explanatory. I am using the documentation prefixes for both, IPv4 (RFC 5737) and IPv6 (RFC 3849):

  • 16a.weberdns.de
  • 16aaaa.weberdns.de
  • 16dual.weberdns.de
  • 32a.weberdns.de
  • 32aaaa.weberdns.de
  • 32dual.weberdns.de
  • 32dual-long.weberdns.de <- with full random IP addresses that are long, i.e., no :: abbreviations for IPv6
  • 64a.weberdns.de
  • 64aaaa.weberdns.de
  • 64dual.weberdns.de

Online tools such as DNSWatch can be used to query the DNS names.

Tests

I added a few security policies in order to use the FQDN objects.

16 – no problem

The objects with the 16x address were no problem. Neither the A, AAAA, nor the dual ones:

weberjoh@pa> request system fqdn show

FQDN Table : Last Request time Fri Aug 26 11:07:15 2016
--------------------------------------------------------------------------------
                      IP Address     Remaining TTL     Secs Since Refreshed
--------------------------------------------------------------------------------
VSYS  : vsys1 (using mgmt-obj dnsproxy object)

16a.weberdns.de  (Objectname h_fqdn_16a.weberdns.de):

                       192.0.2.1              2048                     1552
                      192.0.2.10              2048                     1552
                      192.0.2.11              2048                     1552
                      192.0.2.12              2048                     1552
                      192.0.2.13              2048                     1552
                      192.0.2.14              2048                     1552
                      192.0.2.15              2048                     1552
                      192.0.2.16              2048                     1552
                       192.0.2.2              2048                     1552
                       192.0.2.3              2048                     1552
                       192.0.2.4              2048                     1552
                       192.0.2.5              2048                     1552
                       192.0.2.6              2048                     1552
                       192.0.2.7              2048                     1552
                       192.0.2.8              2048                     1552
                       192.0.2.9              2048                     1552

16aaaa.weberdns.de  (Objectname h_fqdn_16aaaa.weberdns.de):

            2001:db8:0:0:0:0:0:1              2048                     1552
           2001:db8:0:0:0:0:0:10              2048                     1552
           2001:db8:0:0:0:0:0:11              2048                     1552
           2001:db8:0:0:0:0:0:12              2048                     1552
           2001:db8:0:0:0:0:0:13              2048                     1552
           2001:db8:0:0:0:0:0:14              2048                     1552
           2001:db8:0:0:0:0:0:15              2048                     1552
           2001:db8:0:0:0:0:0:16              2048                     1552
            2001:db8:0:0:0:0:0:2              2048                     1552
            2001:db8:0:0:0:0:0:3              2048                     1552
            2001:db8:0:0:0:0:0:4              2048                     1552
            2001:db8:0:0:0:0:0:5              2048                     1552
            2001:db8:0:0:0:0:0:6              2048                     1552
            2001:db8:0:0:0:0:0:7              2048                     1552
            2001:db8:0:0:0:0:0:8              2048                     1552
            2001:db8:0:0:0:0:0:9              2048                     1552

16dual.weberdns.de  (Objectname h_fqdn_16dual.weberdns.de):

                       192.0.2.1              2048                     1552
                      192.0.2.10              2048                     1552
                      192.0.2.11              2048                     1552
                      192.0.2.12              2048                     1552
                      192.0.2.13              2048                     1552
                      192.0.2.14              2048                     1552
                      192.0.2.15              2048                     1552
                      192.0.2.16              2048                     1552
                       192.0.2.2              2048                     1552
                       192.0.2.3              2048                     1552
                       192.0.2.4              2048                     1552
                       192.0.2.5              2048                     1552
                       192.0.2.6              2048                     1552
                       192.0.2.7              2048                     1552
                       192.0.2.8              2048                     1552
                       192.0.2.9              2048                     1552
            2001:db8:0:0:0:0:0:1              2048                     1552
           2001:db8:0:0:0:0:0:10              2048                     1552
           2001:db8:0:0:0:0:0:11              2048                     1552
           2001:db8:0:0:0:0:0:12              2048                     1552
           2001:db8:0:0:0:0:0:13              2048                     1552
           2001:db8:0:0:0:0:0:14              2048                     1552
           2001:db8:0:0:0:0:0:15              2048                     1552
           2001:db8:0:0:0:0:0:16              2048                     1552
            2001:db8:0:0:0:0:0:2              2048                     1552
            2001:db8:0:0:0:0:0:3              2048                     1552
            2001:db8:0:0:0:0:0:4              2048                     1552
            2001:db8:0:0:0:0:0:5              2048                     1552
            2001:db8:0:0:0:0:0:6              2048                     1552
            2001:db8:0:0:0:0:0:7              2048                     1552
            2001:db8:0:0:0:0:0:8              2048                     1552
            2001:db8:0:0:0:0:0:9              2048                     1552

32 – the problems began

As expected, some problems arose when I used the 32x FQDN objects. But not only within the objects, but with the whole Palo Alto. After the commit, the GUI displayed a “not ready” and logged me out after a few seconds,

Palo Alto FQDN Objects device not ready

while the CLI session ended, too. After a re-login, it displayed a “system initializing” message:

Using username "weberjoh".
Last login: Wed Aug 24 11:32:17 2016 from p20030050aa0082001494745f15bf1c6c.dip0.t-ipconnect.de
System initializing; please wait... (CTRL-C to bypass)

Hm. A bit strange. After a re-login I listed the FQDN objects via the CLI. While the 32a object was ok, the 32aaaa was missing some entries (probably due to the longer as 512 byte DNS answer), while the 32dual and 32dual-long were displayed as “Not used” while they were definitely used. That is, I suppose that there is still a bug within the handling of multiple records from a single FQDN name.

weberjoh@pa> request system fqdn show

FQDN Table : Last Request time Fri Aug 26 11:38:37 2016
--------------------------------------------------------------------------------
                      IP Address     Remaining TTL     Secs Since Refreshed
--------------------------------------------------------------------------------
VSYS  : vsys1 (using mgmt-obj dnsproxy object)

32a.weberdns.de  (Objectname h_fqdn_32a.weberdns.de):

                       192.0.2.1              2025                      807
                      192.0.2.10              2025                      807
                      192.0.2.11              2025                      807
                      192.0.2.13              2025                      807
                      192.0.2.14              2025                      807
                      192.0.2.15              2025                      807
                      192.0.2.16              2025                      807
                      192.0.2.17              2025                      807
                      192.0.2.18              2025                      807
                      192.0.2.19              2025                      807
                      192.0.2.20              2025                      807
                      192.0.2.21              2025                      807
                      192.0.2.22              2025                      807
                      192.0.2.23              2025                      807
                      192.0.2.24              2025                      807
                      192.0.2.25              2025                      807
                      192.0.2.27              2025                      807
                      192.0.2.28              2025                      807
                      192.0.2.29              2025                      807
                       192.0.2.3              2025                      807
                      192.0.2.30              2025                      807
                      192.0.2.31              2025                      807
                      192.0.2.32              2025                      807
                       192.0.2.4              2025                      807
                       192.0.2.5              2025                      807
                       192.0.2.6              2025                      807
                       192.0.2.7              2025                      807
                       192.0.2.8              2025                      807
                       192.0.2.9              2025                      807

32aaaa.weberdns.de  (Objectname h_fqdn_32aaaa.weberdns.de):

           2001:db8:0:0:0:0:0:12              2025                      807
           2001:db8:0:0:0:0:0:13              2025                      807
           2001:db8:0:0:0:0:0:14              2025                      807
           2001:db8:0:0:0:0:0:15              2025                      807
           2001:db8:0:0:0:0:0:17              2025                      807
           2001:db8:0:0:0:0:0:18              2025                      807
           2001:db8:0:0:0:0:0:19              2025                      807
           2001:db8:0:0:0:0:0:20              2025                      807
           2001:db8:0:0:0:0:0:24              2025                      807
           2001:db8:0:0:0:0:0:26              2025                      807
           2001:db8:0:0:0:0:0:28              2025                      807
           2001:db8:0:0:0:0:0:29              2025                      807
            2001:db8:0:0:0:0:0:3              2025                      807
           2001:db8:0:0:0:0:0:30              2025                      807
            2001:db8:0:0:0:0:0:4              2025                      807
            2001:db8:0:0:0:0:0:7              2025                      807
            2001:db8:0:0:0:0:0:9              2025                      807

32dual-long.weberdns.de  (Objectname h_fqdn_32dual-long.weberdns.de):

                        Not used

32dual.weberdns.de  (Objectname h_fqdn_32dual.weberdns.de):

                        Not used

I made a second try with only the 32dual-long object (while I disabled all other rules containing my test FQDN objects). The management plane restarted again and logged me out, too. Furthermore, the object was still listed as “Not used” while the other (disabled!) objects were still listed, even after a manual refresh!

weberjoh@pa> request system fqdn show

FQDN Table : Last Request time Fri Aug 26 12:10:15 2016
--------------------------------------------------------------------------------
                      IP Address     Remaining TTL     Secs Since Refreshed
--------------------------------------------------------------------------------
VSYS  : vsys1 (using mgmt-obj dnsproxy object)

32dual-long.weberdns.de  (Objectname h_fqdn_32dual-long.weberdns.de):

                        Not used

After these results I decided to not even test the 64x objects. 😉

What Was That?

Another strange behaviour was this test case: Before I used the 16x and 32x objects, I simply created a domain name called “many.weberdns.de” with 17x A records. But after a first usage, the following records were listed by the CLI. The strange parts are the lines 9, 10, and 20, because these are my DNS servers IP addresses that are definitely not part of the “many.weberdns.de” domain name!

many.weberdns.de  (Objectname h_fqdn_many.weberdns.de):

                     11.31.62.97              3180                       51
                      11.7.40.94              3180                       51
                     116.4.29.46              3180                       51
                     124.9.42.64              3180                       51
                    132.17.21.71              3180                       51
                       17.4.2.11              3180                       51
     2003:51:6012:110:0:0:a07:53              3180                       51
                   213.61.29.182              3180                       51
                      25.65.7.44              3180                       51
                     28.97.1.119              3180                       51
                     38.170.12.0              3180                       51
                     4.73.254.24              3180                       51
                     52.29.39.21              3180                       51
                     56.18.17.64              3180                       51
                    56.43.229.35              3180                       51
                     62.33.29.91              3180                       51
                    67.225.70.20              3180                       51
                  80.154.108.230              3180                       51
                    82.53.61.170              3180                       51
                     95.44.87.54              3180                       51

After some more commits this FQDN object was listed correctly and I was not able to reproduce this behaviour. However, it looked not that reliable. Here it is without any wrong entries:

many.weberdns.de  (Objectname h_fqdn_many.weberdns.de):

                     11.31.62.97              3392                      208
                      11.7.40.94              3392                      208
                     116.4.29.46              3392                      208
                     124.9.42.64              3392                      208
                    132.17.21.71              3392                      208
                       17.4.2.11              3392                      208
                      25.65.7.44              3392                      208
                     28.97.1.119              3392                      208
                     38.170.12.0              3392                      208
                     4.73.254.24              3392                      208
                     52.29.39.21              3392                      208
                     56.18.17.64              3392                      208
                    56.43.229.35              3392                      208
                     62.33.29.91              3392                      208
                    67.225.70.21              3392                      208
                    82.53.61.170              3392                      208
                     95.44.87.54              3392                      208


Conclusion

Let’s first notice that the limitation of 10 IP addresses is not present anymore, which is good. At least 16 IP address objects worked without any problems. Even the 32 A records worked. But all other objects, e.g., 32 AAAA records or even more, are not just “not working” but forced a restart (?) of the management plane. Uh. I am not fully sure whether this is related to my small hardware (PA-200), or to some other side effects such as DNS proxies configured on the Palo, etc. Maybe someone has similar experiences?

Viewing all 340 articles
Browse latest View live


<script src="https://jsc.adskeeper.com/r/s/rssing.com.1596347.js" async> </script>