Quantcast
Channel: Weberblog.net
Viewing all 340 articles
Browse latest View live

IPv6 VPN Routing with Dynamic Prefixes

$
0
0
IPv6 VPN Routing with Dyn Prefix featured image

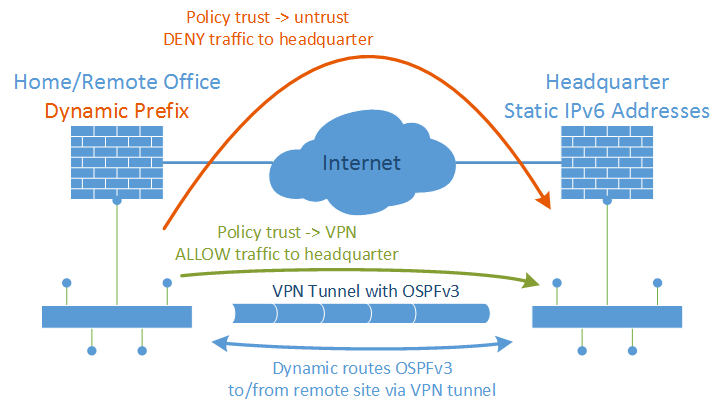
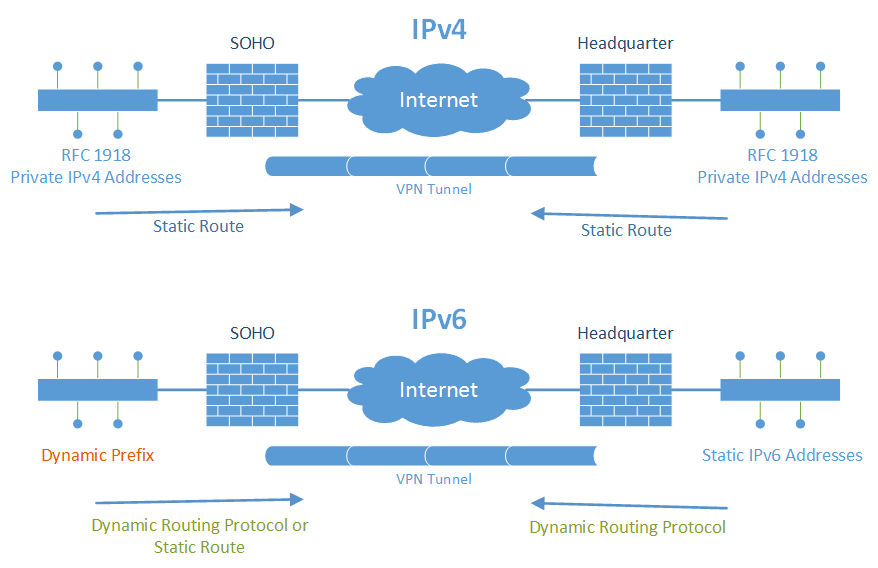
How to route traffic inside an IPv6 site-to-site VPN tunnel if one side offers only dynamic IPv6 prefixes? With IPv4, the private network segments were statically routed through the tunnel. But with a dynamic prefix, a static route is not possible. That is, a dynamic routing protocol must be used. Here is an example of how I used OSPFv3 for IPv6 between my VPN endpoints.

In detail, I have a home office with a dual stack ISP connection. However, this connection has a dynamic IPv6 prefix: After every reboot or lost connection of the firewall, I get a new IPv6 prefix. This is really bad for building a site-to-site VPN to the headquarter. Since I don’t want to use any kind of NAT/NPTv6 with unique local addresses, I am talking OSPFv3 over the VPN tunnel in order to route the dynamic prefix range (global unicast) via the tunnel.

Pre Notes

My ISP (Deutsche Telekom) offers a dual stack connection, ref [de]: connection establishment. I am currently using a Juniper ScreenOS SSG firewall for the PPPoE connection, ref: DHCPv6 prefix delegation. Furthermore, I want to implement the IPv6 site-to-site VPN recommendations. I am using OSPFv3 for IPv6 similar to my test lab. The site-to-site VPN tunnel is established over IPv4, but tunnels both protocols, ref: IPv6 through IPv4 VPN tunnel.

OSPFv3 and Policies

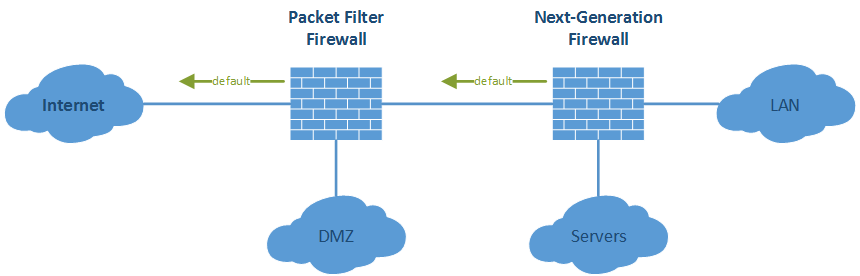
Well, the solution is quite simple: Activate OSPFv3 on the tunnel interfaces and on all trust networks. After a new IPv6 prefix is received and the site-to-site tunnel is established, the remote office prefix will be reachable from the headquarter through the VPN tunnel. However, in order to prevent unencrypted traffic flows through the mere Internet, some additional security policies on the remote office must be in place. This is needed to not only rely on the dynamic routing protocol OSPFv3 for security issues. Security (i.e., blocking false connections) must be done at the security stage, not on the routing layer. The following policies must be used on the remote site:

  • trust -> untrust: deny to headquarter! (<- with this rule, traffic to the headquarter won’t go directly to the Internet in case of a VPN failure)
  • trust -> VPN: allow to headquarter (<- only this direction should be used)

On the headquarter, there is no way to implement any specific policy rules, e.g., from untrust -> trust, because you simply do not know the dynamic prefix of the remote office. The same set of policies as always can be used:

  • untrust -> trust: deny any
  • untrust -> DMZ: public services allowed, remaining deny
  • trust -> untrust: (mostly) allow
  • trust -> VPN: (mostly) allow
  • VPN -> trust/DMZ: (mostly) allow

Example with Juniper SSGs

This is an overview of the network settings:

IPv6 VPN Routing with Dyn Prefix

The implementation looks as follows: (Refer to the descriptions beneath the screenshots)

Headquarter: IPv6 enabled on the tunnel interface. Headquarter: OSPFv3 enabled on the tunnel interface. Remote Site: Policy from trust -> untrust: Deny traffic to headquarter! This would be the case in a VPN failure. Remote Site: But allow traffic to the headquarter from trust -> VPN.

That is, the IPv6 prefix of the remote site is inserted in the routing table on the headquarter:

Headquarter: Route to the dynamic prefix of the remote site through the VPN tunnel, received via OSPFv3. Remote Site: Many routes to the headquarter, all received via OSPFv3. Note the "connected" routes, that are advertised through DHCPv6 from the ISP.

Or listed via the CLI:

fd-wv-fw01-> get vrouter trust-vr route v6 protocol ospfv3
H: Host C: Connected S: Static A: Auto-Exported
I: Imported R: RIP/RIPng P: Permanent D: Auto-Discovered
N: NHRP
iB: IBGP eB: EBGP O: OSPF/OSPFv3 E1: OSPF external type 1
E2: OSPF/OSPFv3 external type 2 trailing B: backup route

Total 21/max entries

         ID                                   IP-Prefix       Interface
                                                Gateway   P Pref    Mtr     Vsys
--------------------------------------------------------------------------------------
         56                       2003:51:6012:101::/64          eth0/6
                                                     ::   O   60    100     Root
*        78                       2003:51:6012:102::/64          eth0/6
                               fe80::21a:6cff:fea1:2b98   O   60    200     Root
         54                       2003:51:6012:110::/64       eth0/5.10
                                                     ::   O   60    100     Root
*        82                       2003:51:6012:121::/64          eth0/6
                              fe80::b60c:25ff:fe05:8e10   O   60    110     Root
*        83                       2003:51:6012:120::/64          eth0/6
                              fe80::b60c:25ff:fe05:8e10   O   60    110     Root
*        87                       2003:51:6012:123::/64          eth0/6
                              fe80::b60c:25ff:fe05:8e10   O   60    110     Root
*        85                       2003:51:6012:125::/64          eth0/6
                              fe80::b60c:25ff:fe05:8e10   O   60    110     Root
*        86                       2003:51:6012:124::/64          eth0/6
                              fe80::b60c:25ff:fe05:8e10   O   60    110     Root
*        79                       2003:51:6012:130::/64          eth0/6
                               fe80::2a94:fff:fea8:772d   O   60    200     Root
*        80                       2003:51:6012:160::/64          eth0/6
                                fe80::a5b:eff:fe3c:115d   O   60    200     Root
*        81                       2003:51:6012:180::/64          eth0/6
                               fe80::20c:29ff:fe63:2159   O   60    110     Root
*        75                      2003:50:aa0c:1300::/64           tun.2
                                 fe80::fce5:40ff:fe14:1   O   60  10100     Root
*        76   2003:50:aa0c:1342:b2c6:9aff:fefd:ca97/128           tun.2
                                 fe80::fce5:40ff:fe14:1   O   60  10000     Root

Total number of ospfv3 routes: 13

(Note: There is something wrong with the OSPFv3 route to the “wireless0/2” subnet on the remote site. It is only listed as a /128 route to the IPv6 address of the interface and not as a /64 route the whole subnet. I do not know why, but suppose an issue with the OSPFv3 handling on the wireless0/2 interface on the Juniper. Maybe someone has an idea?)

Conclusion

Of course, it is not optimal to have dynamic prefixes at a remote site. It is always preferable to have static addresses. However, as with IPv4, many home offices etc. have only dynamic addresses, or dynamic prefixes within IPv6. With this “OSPFv3 over VPN tunnel” approach, it is possible to use the allocated IPv6 range (global unicast addresses, GUA) at remote sites while still routing traffic to the headquarter through a site-to-site VPN tunnel. It avoids using unique local addresses (ULA) for remote sites in conjunction with NPTv6.


IPv6 Dyn Prefix Problems

$
0
0
IPv6 Dynamic Prefix Problems featured image

I am lucky to have a full dual-stack ISP connection at home. However, the ISP only offers a dynamic IPv6 prefix with all of its disadvantages (while no single advantage). In this post, I am summarizing the limitations of a dynamic prefix and some of the ideas on how to overcome them. I am always comparing the “IPv6 dynamic prefix” state with the legacy “dynamic IPv4 address” situation. I suppose that some of these problems will hit many small office / home office locations during the next years.

Of course, IPv6 ISP connections with dynamic prefixes should only be purchased at private home sites. It is no problem to have new IPv6 addresses there because all connections are outbound. However, many small remote offices (SOHO) might rely on such cheap ISP connections, too. If they provide some servers in a DMZ or other components such as network cameras, building components with IPv6 connections, etc., they will run into these kind of problems.

DNS Changes

One of the biggest problems are the many DNS changes inside the trusted network. If a company provides several IPv6 services that are running on IPv6 nodes, each IPv6 DNS record must be changed to the new IPv6 address in case of a prefix change.

DNS Changes

In the case of IPv4, only the router had a single IPv4 address and a “Dyn DNS” service. Several port forwardings were used to reach the servers behind it. In the IPv6 world, every single service/address would require an own dyn DNS name. This might work for some Linux based servers that can run a dyn DNS client, but not for many other appliances such as printers, network cameras, coffee machines, or what ever.

A possible solution for this would be the usage of a DNS server that updates many AAAA records based on a single updated prefix, such as listed here. Currently, this is not widely available at dynamic DNS servers.

Security Policies with DynDNS Ranges

A similar problem is the usage of the dynamic prefix within security policies (ACLs) on other sites. For example, with IPv4 it was possible to have a policy at the headquarter that allows all connections from the single dyn DNS FQDN from the remote office to reach all services inside the network. This is not possible for an IPv6 prefix since there is no DNS type that lists the whole prefix.

Security Policies

Such policies can be used e.g. to manage servers in the DMZ via SSH. The protocol itself is authenticated and encrypted, while it is still desirable to block incoming SSH connections from the whole world into the DMZ.  FQDN policy objects can allow these connections.

(Even though the first IPv6 problem concerning the DNS changes would be solved, this won’t help here since all IPv6 clients will have an own and interchangeable IPv6 address that won’t be listed somewhere.)

An option would be the usage of the experimental RFC 3123: A DNS RR Type for Lists of Address Prefixes (APL RR) which has DNS RR type 42. If the ISP router would update this DNS record and if the headquarter firewall could use this type of record, a security policy could be built similar to those on IPv4 FQDN address objects.

Routing inside IPv6 VPN Tunnels

IPv4 site-to-site VPN tunnels always route the other IPv4 networks statically through the tunnel. Both sides (mostly) relied on private RFC 1918 addresses. In the IPv6 world, the site with a dynamic prefix is not reachable via a static route. A dynamic routing protocol must be used.

Routing inside VPN Tunnels

Luckily, this is the only case that is already solved today. I showed in this blog post how I am using OSPFv3 on a site-to-site VPN tunnel.

Comments?

I am highly interested in comments/suggestions/field reports from other IPv6 adopters. Please use the comment section below!

Palo Alto Remote Access VPN for Android

$
0
0
Android Palo VPN featured image

For a basic remote access VPN connection to a Palo Alto Networks firewall (called “GlobalProtect”), the built-in VPN feature from Android can be used instead of the GlobalProtect app from Palo Alto itself. If the additional features such as HIP profiling are not needed, this variant fits perfectly.

I am showing a few screenshots and logs from the Android smartphone as well as from the Palo Alto to show the differences.

This post is very similar to the post about the iPhone. I am running a PA-200 with PAN-OS version 7.0.3. The phone is a Samsung Galaxy S4 Mini with Android version 4.4.2.

The GlobalProtect app from Palo Alto works without any problems if a correct Portal and Gateway are already configured. In order to use the native “IPSec Xauth PSK” on Android, the “X-Auth Support” must be enabled on the GlobalProtect Gateway, such as shown here in my post about the Linux vpnc client.

GlobalProtect App vs. Native VPN

The following Android screenshots show the configuration steps for the native IPsec VPN tunnel. The “IPSec Xauth PSK” type must be chosen:

Choose "IPSec Xauth PSK" as type. Enter the "Group Name" and "Group Password", as it is called by Palo Alto. And, of course, the user login.

Just for a comparison: The GlobalProtect app looks like that:

GlobalProtect app. Connect. Status.

Palo Alto Logs

It is interesting to see the differences in the Palo Alto logs, i.e., the GlobalProtect Previous User, System Log and Traffic Log. Here are the differences:

GlobalProtect Previous User: The native Android client does not reveal the "Client" version. System Log: The differences are highlighted. Traffic Log: In my case, the native Android client was recognized as "ciscovpn", while the GlobalProtect app as "panos-globa-protect" and "web-browsing" on port 443 (!).

That’s it. 😉

Cisco ASA Remote Access VPN for Android

$
0
0
Android ASA VPN featured image

The native Android IPsec VPN client supports connections to the Cisco ASA firewall. This even works without the “AnyConnect for Mobile” license on the ASA. If only a basic remote access VPN connection is needed, this fits perfectly. It uses the classical IPsec protocol instead of the newer SSL version. However, the VPN tunnel works anyway.

In this short post I am showing the configuration steps on the ASA and on the Android phone in order to establish a remote access VPN tunnel.

I am running a Cisco ASA 5505 with version 9.2(4). The Android smartphone is a Samsung Galaxy S4 Mini with Android 4.4.2.

Cisco ASA Config

The configuration steps on the ASA are mostly the same as for a classical VPN-Client connection profile:

Group Poliy: Enable at least IPsec IKEv1. Choose DNS Servers. Connection Profile: Choose a PSK, an Address Pool, and select the Group Policy. NOTE: The name of this connection profile is the later on used "IPsec Identifier". Crypto Map: Delete all "DES" and "3DES" Proposals!!! Crypto Map 2nd screen. Crypto Map last screen. IKE Policies. Don't forget to enable IPsec on the outside interface.

Or the appropriate CLI commands:

ip local pool Pool_192.168.133.0 192.168.133.10-192.168.133.99 mask 255.255.255.0
!
crypto ipsec ikev1 transform-set ESP-AES-128-SHA esp-aes esp-sha-hmac
crypto ipsec ikev1 transform-set ESP-AES-256-SHA esp-aes-256 esp-sha-hmac
!
crypto dynamic-map SYSTEM_DEFAULT_CRYPTO_MAP 65535 set pfs group5
crypto dynamic-map SYSTEM_DEFAULT_CRYPTO_MAP 65535 set ikev1 transform-set ESP-AES-256-SHA ESP-AES-128-SHA
crypto dynamic-map SYSTEM_DEFAULT_CRYPTO_MAP 65535 set ikev2 ipsec-proposal AES256
crypto map outside_map 65535 ipsec-isakmp dynamic SYSTEM_DEFAULT_CRYPTO_MAP
crypto map outside_map interface outside
!
crypto ikev1 enable outside
crypto ikev1 policy 10
 authentication pre-share
 encryption aes-256
 hash sha
 group 5
 lifetime 28800
crypto ikev1 policy 30
 authentication pre-share
 encryption aes-256
 hash sha
 group 2
 lifetime 28800
crypto ikev1 policy 90
 authentication pre-share
 encryption aes
 hash sha
 group 2
 lifetime 28800
!
group-policy MainVPN internal
group-policy MainVPN attributes
 dns-server value 8.8.8.8 8.8.4.4
 vpn-tunnel-protocol ikev1 ssl-client
 default-domain value webernetz.net
!
tunnel-group MainVPN type remote-access
tunnel-group MainVPN general-attributes
 address-pool Pool_192.168.133.0
 default-group-policy MainVPN
tunnel-group MainVPN ipsec-attributes
 ikev1 pre-shared-key *****


Android IPsec PSK

This is how the VPN connection must be configured:

Add a new VPN with "IPSec Xauth PSK". Type in the name of the connection profile on the ASA as well as the PSK. Login with a user from the ASA. Connection established.

ASA Logs

After a connection establishment, the VPN session details on the ASA show details:

Cisco ASA Session Details

And, of course, via the CLI:

fd-wv-fw03# show vpn-sessiondb ra-ikev1-ipsec

Session Type: IKEv1 IPsec

Username     : weberjoh               Index        : 233
Assigned IP  : 192.168.133.10         Public IP    : 194.29.191.227
Protocol     : IKEv1 IPsecOverNatT
License      : Other VPN
Encryption   : IKEv1: (1)AES256  IPsecOverNatT: (1)AES256
Hashing      : IKEv1: (1)SHA1  IPsecOverNatT: (1)SHA1
Bytes Tx     : 138957                 Bytes Rx     : 483030
Group Policy : MainVPN                Tunnel Group : MainVPN
Login Time   : 15:46:24 CEST Mon Oct 26 2015
Duration     : 0h:14m:20s
Inactivity   : 0h:00m:00s
VLAN Mapping : N/A                    VLAN         : none
Audt Sess ID : c0a88201000e9000562e3cc0
Security Grp : none


Handstaubsauger Akkupack erneuert

$
0
0
P1290829 Handstaubsauger featured image

Hier mal ein kleiner Do-it-Yourself Beitrag. Einfache Aufgabenstellung: Der Akkupack in unserem überlebensnotwendigem Handstaubsauger (AEG Junior 2.0) ist nach einigen Jahren faktisch nicht mehr zu gebrauchen. Ein neuer musste her. Und es stand natürlich fest, dass kein neuer Handstaubsauger, sondern nur ein neuer Akkupack da rein musste. Bei Reichelt fand ich schließlich etwas größere Akkus als die original verbauten, welche eine ordentliche Portion mehr an Leistung haben.

Auseinanderbauen lässt sich das Teil mit nur zwei Schrauben und dem vorherigen Entfernen des Beutels. Dann gleich die Überraschung: Die verwendeten Akkus sind deutlich kleiner als es die Aussparung erlaubt hätte. Es sind von der Größe her normale Mignon (AA) Zellen verbaut, welche mit einem kleinen Rahmen passgenau im Staubsauger Platz finden.

Größere Akkus

Die Idee war natürlich, möglichst große Akkus zu verbauen. Eine kurze Suche brachte mich direkt zu fertigen Akkupacks auf Amazon (1, 2), welche jeweils 2000 mAh liefern würden. Ich baute den Staubsauger aber erst einmal auseinander um zu vermessen, ob nicht auch größere Akkus reinpassen würden. Verwundert war ich recht schnell darüber, dass dort quasi normale Mignon (AA) Zellen zum Einsatz kamen, welche deutlich kleiner als die vorhandene Aussparung waren! Nur durch eine große zusätzliche Halterung wurden sie im Staubsauger angebracht:

Originaler Akku noch eingebaut Originaler Akku mit weißer Plastikhülle

Das doofe nur: Die nächst größeren Akkus (Baby, Typ C) wären zu groß gewesen. Glücklicherweise habe ich aber einen weiteren Akkutyp gefunden, der die gleiche Länge wie Mignon, aber einen größeren Durchmesser hatte. Er liefert satte 2700 mAh Stunden, also deutlich mehr, also die maximalen 2100 mAh von einer Mignon Zelle. Im Vergleich zum originalen Akkupack (1300 mAh) sogar mehr als doppelt so viel! Hier ein Vergleich der Werte, wobei ich nicht auf die Kosten eingehe, die bei den “fertigen” Akkupacks bei Amazon definitiv höher sind als wenn man sie selber direkt bei Reichelt kauft: (Mignon zu klein, Baby zu groß, anderer Typ viel Leistung.)

 LeistungDurchmesser
einer Zelle
[mm]
Länge
einer Zelle
[mm]
Verfügbarer
Platz
-2052
Originaler
Akkupack
1300 mAh14,549
Mignon AA2100 mAh14,549
Baby C(4000 mAh)28,850
Anderer Typ
von Reichelt
2700 mAh1750

Umbau

Nach der Lieferung erfolgte der Einbau. Hier erst mal ein Größenvergleich von handelsüblichen Mignon Zellen, dem originalen Akkupack und rechts dem zusammengeklebten Pack von Reichelt:

Mignon, Originaer Akkupack, neuer, etwas größerer, Akkupack. Links alt, rechts neu.

Der Einbau war leicht. Lediglich etwas Lötarbeit. Hier das fertige Gerät mit einer kleinen Unterlage, damit der neue Akkupack nicht zu sehr wackelt, da er ja immer noch “zu klein” für die Aussparung im Staubsauger ist:

Neuer Akkupack Fertig Unterlage, damit der Akkupack nicht wackelt.

Und hier noch ein audiovisueller Hörvergleich der Lautstärken:

Bessere Antennen für den ADS-B Flugzeugempfang

$
0
0
Freigestellt2

Seit mittlerweile mehr als einem Jahr betreibe ich aus Spaß einen eigenen Flightradar Server. Außerdem hatte ich einen weiteren ADS-B Empfänger am Raspberry Pi in Betrieb genommen. Was also noch gefehlt hat ist eine Verbesserung der Empfangsqualität, sprich: bessere Antennen als die mitgelieferten Stummeldinger. Dafür habe ich zusätzlich zu der beim DVB-T Stick mitgelieferten Antenne drei weitere Antennen gekauft und getestet um herauszufinden, wie ich den Empfang maximieren kann. Schnell wurde klar, dass sie alle nicht für den Empfang von ADS-B Signalen taugen. Daher griff ich zur Selbstbastellösung, von denen es im Internet einige gibt, und zeige hier meine Bastelei sowie die Testergebnisse der deutlich besseren Antennen.

Gekaufte DVB-T Antennen

Folgende Antenne habe ich käuflich erworben und getestet (Preise zum jeweiligen Kaufzeitpunk):

  1. Hama DVB-T Zimmerantenne 40dB für 13,90 €.
  2. mumbi DVB – T Antenne 3dB passiv mit Magnetfuss für 3,70 € inkl. Versandkosten.
  3. Antenne für DVB-T USB Stick und mobile Geräte für 15,99 €.

Hier zwei Fotos davon. Auf dem ersten sieht man die originale sowie die beiden kleinen Stabantennen, auf dem zweiteren (hinten) die große Hama-Antenne:

Originale und zwei weitere Stabantennen. Große Hama Antenne hinter dem Notebook.

Kurz und knapp: Für den Empfang von ADS-B Signalen haben alle Antennen überhaupt nichts gebracht. Im Gegenteil: Der Empfang war sogar deutlich schlechter (!) als mit der mitgelieferten Antenne. Das ist physikalisch natürlich erklärbar, da diese DVB-T Antennen auf den Frequenzbereich für eben DVB-T spezialiesiert sind und ADS-B mit seinen 1090 MHz nun mal darüber liegt.

Do-it-Yourself ADS-B Antenne

Irgendwie kam ich kurz später auf einen Artikel der Zeitschrift Funkamateur. Im Heft 4/13 ab Seite 377 befindet sich der Artikel “Empfang von ADS-B-Flugzeugdaten mit einem DVB-T-Stick”, in welchem grob erklärt wird, wie das mit ADS-B so abläuft (in etwa also das, was ich auch hier schon gemacht hatte). Neu war allerdings der Selbstbau einer auf die Frequenz von ADS-B optimierten Antenne. Es handelt sich dabei um eine Groundplane-Antenne, welche relativ einfach zu konstruieren ist. Etwas gezielte Googlelei brachte mich außerdem auf die PDF Datei “Your First ADSB Antenna” von dieser Seite hier. Los geht’s:

Was eine Groundplane-Antenne ist, kann man bei Wikipedia ja gut nachlesen. Die Bauteile, allen voran die N-Einbau-/Flanschbuchse, den 2,5 mm² Kupferdraht und diversen Adaptern habe ich wie immer bei Reichelt bestellt. (Anmerkung: Im Nachhinein wäre es sinniger gewesen, nach einer anderen Buchse vom Typ Flansch zu suchen, um nicht so viele Adapter benutzen zu müssen.)

Zur Berechnung der Länge der Kupferdrähte muss man folgendes verwenden: Die Wellenlänge \lambda ist die Ausbreitungsgeschwindigkeit c durch die Frequenz der Welle f, also: \lambda = \frac{c}{f}. Bei uns ist die Ausbreitungsgeschwindigkeit die Lichtgeschwindigkeit (ca. 300.000~km/s) und die Frequenz die bereits oft erwähnten 1090 MHz, also: \lambda = \frac{299792458~m/s}{1090000000~Hz} = 0,275~m = 27,5~cm. Der Strahler und die Radials der Groundplane-Antenne müssen die Länge \lambda/4, also konkret 27,5~cm/4 = 68~mm haben.

Bastelzeit! 😉 Im folgenden ein paar Bilder vom Bau der Antennen sowie der Adapter-Batterien die zum Einsatz kommen (was natürlich suboptimal ist). Die letzten beiden Bilder zeigen meine beiden Antennen im Einsatz (indoor und outdoor).

Multifunktionsschreibtisch. Radials aus 2,5 mm² Kupferdraht und M4 Schrauben. Radials und Strahler angelötet/-schraubt. Fertig geschnitten und gebogen. Nahaufnahme. Adapterset. ;) Antenne auf Holzsockel. Antenne 1 indoor am Windows XP Notebook. Antenne 2 outdoor am Raspberry Pi.

Test Indoor

Es folgten ein paar Tests. Bei der indoor Antenne habe ich einfach nur die Anzahl der empfangenen Flugzeuge zu einem Zeitpunkt verglichen. Sensationelles Ergebnis:

  • Originale DVB-T Antenne: 39 Flugzeuge
  • Selbstbau ADS-B Antenne: 63 Flugzeuge

Das macht eine Verbesserung um 61 %. Wow!

Test Outdoor

Bei der outdoor Antenne habe ich mir etwas mehr Mühe gegeben und den “Receiver Range” von meinem Virtual Radar Server über einen Zeitraum von 7 Tagen ausgewertet. Also natürlich zwei Mal: Einmal mit der Stummelantenne, einmal mit der DIY Antenne. Hier die Screenshots mit den Empfangsbereichen beider Antennen, welche sehr deutlich zeigen, dass die DIY Antenne einen deutlich erweiterten Empfangsbereich hat. Die verschiedenen Farben sind die Empfangsbereiche in verschiedenen Flugzeughöhen.

Empfangsbereiche Stummelantenne. Vergleich DIY-Antenne.

Wahnsinn!

Links

Und weil ich es weiterhin einfach so cool finde, hier noch mal ein Screenshot vom Bereich Frankfurter Flughafen. Einfach geil. 😉

Noch mal ein Screenshot ADS-B Frankfurt

FortiGate 2-Factor Authentication via SMS

$
0
0
FortiGate SMS featured image

Two-factor authentication is quite common these days. That’s good. Many service providers offer a second authentication before entering their systems. Beside hardware tokens or code generator apps, the traditional SMS on a mobile phone can be used for the second factor.

The FortiGate firewalls from Fortinet have the SMS option built-in. No feature license is required for that. Great. The only thing needed is an email-to-SMS provider for sending the text messages. The configuration process on the FortiGate is quite simple, however, both the GUI as well as the CLI are needed for that job. (Oh Fortinet, why aren’t you improving your GUI?)

Here is a step-by-step configuration tutorial for the two-factor authentication via SMS from a FortiGate firewall. My test case was the web-based SSL VPN portal.

The second factor is sent via SMS. More precisely: via email2sms. That is: The FortiGate sends an email to <phone-number>@email2sms-provider.tld with the authentication code. In order to use this feature, an email server as well as an SMS service must be configured. I am not using the “FortiGuard Messaging Service” for this test but a “Custom” Email-2-SMS service from the Internet (just found via Google).

I am using a FortiWiFi 90D with FortiOS 5.2.4, build688.

Email Service

The SMTP server should be configured anyway in order to receive alert emails from the FortiGate. If it is not configured yet, it is done under System -> Config -> Advanced -> Email Service:

FortiGate SMS 01 Email Service

SMS Service

The SMS service settings are directly below the email service. Only a name and the “Domain” must be entered. This was a bit confusing for me as I saw it the first time since no other options can be set. But in fact, the FortiGate will send all SMS to <number@domain>. So it really does not need any more information. The correct domain for the mail2sms gateway is listed on the service you chose on the Internet. (I am using websms.com, a German provider.)

FortiGate SMS 02 SMS Service

User

The most annoying point is to activate the two-factor SMS authentication for the user since it cannot be done through the GUI. Furthermore, if you add users, the GUI from FortiGate is not consistent in storing the phone number for local users. (As with almost all cases, the GUI from Fortinet is not that good.) So take care!

The phone number can be entered via the GUI, as well as the “Custom” SMS provider, but the only option for the “Enable Two-factor Authentication” is the Token, which we won’t use here:

FortiGate SMS 03 User Phone Number FortiGate SMS 04 No SMS Option

Use the CLI in order to configure the following command for each user (line 3):

fd-wv-fw04 # config user local
fd-wv-fw04 (local) # edit weberjoh2
fd-wv-fw04 (weberjoh2) # set two-factor sms
fd-wv-fw04 (weberjoh2) # next

After that, the two factor auth method “sms” is shown in the summary as well as under the users details:

FortiGate SMS 05 sms after enabled via CLI FortiGate SMS 06 sms after enabled via CLI

That’s all for the config.

Test

My use case for the two-factor authentication is the web-based SSL VPN. Following are the screenshots I’ve made during the logon process, as well as the log events:

FortiGate SMS 07 Login first factor FortiGate SMS 08a iPhone SMS received FortiGate SMS 08b Login second SMS factor FortiGate SMS 09 Successfully logged in FortiGate SMS 10 SSL-VPN Monitor FortiGate SMS 11 Event Log System FortiGate SMS 12 Event Log VPN

The corresponding log messages on the CLI look like this:

23: date=2015-12-03 time=17:23:16 logid=0100038411 type=event subtype=system level=notice vd="root" logdesc="Two-factor authentication code sent" user="weberjoh2" action="send authentication code" msg="Send two-factor authentication token code 047548 to 004********211@email2sms.websms.com"

24: date=2015-12-03 time=17:23:16 logid=0101039943 type=event subtype=vpn level=information vd="root" logdesc="SSL VPN new connection" action="ssl-new-con" tunneltype="ssl" tunnelid=0 remip=87.159.185.106 tunnelip=(null) user="N/A" group="N/A" dst_host="N/A" reason="N/A" msg="SSL new connection"

I like it. Easy to use, even for non-technical persons. 😉

Links

Basic IPv6 Configuration on a FortiGate Firewall

$
0
0
FortiGate IPv6 Config Commands featured image

It’s really great that the FortiGate firewalls have a DHCPv6 server implemented. With this mandatory service, IPv6-only networks can be deployed directly behind a FortiGate because the stateless DHCPv6 server provides the DNS server addresses. (This is unlike Palo Alto or Cisco which have no DHCPv6 server implemented.)

However, the configuration on the FortiGate is really bad because nothing of the IPv6 features can be set via the GUI. (And this is called a Next-Generation Firewall? Not only the features count, but also the usability!) Everything must be done through the CLI which is sometimes hard to remember. Therefore I am publishing this memo of the appropriate CLI configuration commands.

Coming from Cisco devices (which only have the CLI ;)), the structure of the command line interface from Fortinet is quite different. That’s ok but I need some memos for that. What I really don’t like are the inconsistencies within the CLI, e.g. sometimes it’s called “ipv6”, sometimes “ip6”. Oh oh. At least the IPv6 policies can be configured through the GUI.

I am running a FortiWiFi 90D with FortiOS v5.2.4, build688.

End-User Interface

A basic end-user interface needs an IPv6 address, router advertisements with the O-flag (for using stateless DHCPv6), as well as an advertised prefix with the O- and A-flag. Furthermore, a stateless DHCPv6 server provides the DNS server addresses. Here we go:

config system interface
    edit "fg-trust3"
            config ipv6
                set ip6-allowaccess ping https ssh
                set ip6-address 2003:51:6012:162::1/64
                set ip6-send-adv enable
                set ip6-other-flag enable
                    config ip6-prefix-list
                        edit 2003:51:6012:162::/64
                            set autonomous-flag enable
                            set onlink-flag enable
                        next
                    end
            end
    next
end
config system dhcp6 server
    edit 1
        set domain "webernetz.net"
        set interface "fg-trust3"
        set dns-server1 2001:4860:4860::8888
        set dns-server2 2001:4860:4860::4444
    next
end

Of course, there are much more options to fine-tune the timers, etc. But the just listed commands are the very basic configuration steps to make it running.

For your interest, this is how my IPv6-only network on a Windows 7 machine looks like with the just proposed settings:

FortiGate IPv6 Config Commands Windows 7 Network

Routing

For routing IPv6 traffic within the network, static routes or OSPFv3 are quite common. The commands for those are the following. (Have a look at my OSPFv3 blog post which lists the appropriate commands for many other firewall and router devices.)

config router static6
    edit 1
        set gateway 2003:51:6012:101::1
        set device "wan1"
    next
end
config router ospf6
    set auto-cost-ref-bandwidth 10000
    set router-id 172.16.1.6
        config area
            edit 0.0.0.0
            next
        end
        config ospf6-interface
            edit "wan1"
                set interface "wan1"
            next
            edit "fg-trust3"
                set interface "fg-trust3"
            next
        end
    set passive-interface "fg-trust3"
end


Show and Get and Diagnose

To verify the working settings of the FortiGate, this CLI commands can be used:

fd-wv-fw04 # diagnose ipv6 address list
dev=73 devname=fg-trust3 flag=P scope=0 prefix=64 addr=2003:51:6012:162::1
dev=70 devname=vsys_fgfm flag=P scope=254 prefix=128 addr=::1
dev=68 devname=vsys_ha flag=P scope=254 prefix=128 addr=::1
dev=63 devname=fg-trust flag=P scope=0 prefix=64 addr=2003:51:6012:160::1
dev=59 devname=root flag=P scope=254 prefix=128 addr=::1
dev=6 devname=wan1 flag=P scope=0 prefix=64 addr=2003:51:6012:101::6
dev=6 devname=wan1 flag=P scope=253 prefix=10 addr=fe80::a5b:eff:fe3c:115d
dev=73 devname=fg-trust3 flag=P scope=253 prefix=10 addr=fe80::a5b:eff:fe3c:115c
dev=63 devname=fg-trust flag=P scope=253 prefix=10 addr=fe80::a5b:eff:fe3c:115c

fd-wv-fw04 # diagnose ipv6 neighbor-cache list
ifindex=6 ifname=wan1 ff02::5 33:33:00:00:00:05 state=00000040 use=241 confirm=8282556 update=8276556 ref=1
ifindex=6 ifname=wan1 ff02::6 33:33:00:00:00:06 state=00000040 use=455 confirm=6566 update=566 ref=1
ifindex=59 ifname=root :: 00:00:00:00:00:00 state=00000040 use=8278891 confirm=8284891 update=8278891 ref=10
ifindex=73 ifname=fg-trust3 ff02::c 33:33:00:00:00:0c state=00000040 use=261418 confirm=267418 update=261418 ref=1
ifindex=6 ifname=wan1 2003:51:6012:101::1 00:19:e2:a1:f9:8a state=00000002 use=151 confirm=470 update=470 ref=2
ifindex=73 ifname=fg-trust3 2003:51:6012:162:8458:5fee:7eb2:77d4 00:0c:29:15:f8:40 state=00000002 use=2076 confirm=2016 update=2016 ref=2
ifindex=6 ifname=wan1 fe80::20c:29ff:fe63:2159 00:0c:29:63:21:59 state=00000004 use=6676402 confirm=6676402 update=2760067 ref=1
ifindex=6 ifname=wan1 fe80::219:e2ff:fea1:f98a 00:19:e2:a1:f9:8a state=00000002 use=0 confirm=77 update=77 ref=3

fd-wv-fw04 # get router info6 routing-table
IPv6 Routing Table
Codes: K - kernel route, C - connected, S - static, R - RIP, O - OSPF,
       IA - OSPF inter area
       N1 - OSPF NSSA external type 1, N2 - OSPF NSSA external type 2
       E1 - OSPF external type 1, E2 - OSPF external type 2
       I - IS-IS, B - BGP
       * - candidate default

Timers: Uptime

S*      ::/0 [10/0] via 2003:51:6012:101::1, wan1, 23:00:41
C       ::1/128 via ::, root, 23:00:49
O       2003:50:aa3d:1dfe:b2c6:9aff:fefd:ca97/128 [110/10010] via fe80::219:e2ff:fea1:f98a, wan1, 22:59:59
C       2003:51:6012:101::/64 via ::, wan1, 23:00:49
O       2003:51:6012:110::/64 [110/110] via fe80::219:e2ff:fea1:f98a, wan1, 22:59:59
O       2003:51:6012:130::/64 [110/110] via fe80::2a94:fff:fea8:772d, wan1, 22:59:59
C       2003:51:6012:160::/64 via ::, fg-trust, 23:00:49
C       2003:51:6012:162::/64 via ::, fg-trust3, 15:34:22
O       2003:51:6012:180::/64 [110/20] via fe80::20c:29ff:fe63:2159, wan1, 22:59:59
C       fe80::/10 via ::, fg-trust3, 15:34:22


CLI Commands for Troubleshooting FortiGate Firewalls

$
0
0
CLI Commands for FortiGate Firewalls

This blog post is a list of common troubleshooting commands I am using on the FortiGate CLI. It is not complete nor very detailled, but provides the basic commands for troubleshooting network related issues that are not resolvable via the GUI. I am not focused on too many memory, process, kernel, etc. details. These must only be used if there are really specific problems. I am more focused on the general troubleshooting stuff.

Coming from Cisco, everything is “show”. With Fortinet, you have the choice between “show | get | diagnose | execute“. Not that easy to remember. Likewise the “sys | system” keyword. It is always “diagnose sys” but “execute system”. 😉

Entering the correct vdom/gobal Config

Remember to enter the correct vdom or global configuration tree before configuring anything:

config global
config vdom
	edit <vdom-name>

To show the running configuration (such as “show run”), simply type in:

show

To show the entire running configuration with default values, use:

show full-configuration


General Information

The very basics:

get system interface physical	#overview of hardware interfaces
get hardware nic <nic-name>		#details of a single network interface, same as: diagnose hardware deviceinfo nic <nic-name>
get system status				#==show version
get system performance status	#CPU and network usage
diagnose sys top				#top with all forked processed
diagnose sys top-summary		#top easier, incl. CPU and mem bars. Forks are displayed by [x13] or whatever
execute dhcp lease-list
diagnose ip arp list
diagnose ipv6 address list
diagnose ipv6 neighbor-cache list
diagnose sys ntp status
diagnose autoupdate versions	#lists the attack definition versions, last update, etc.
diagnose log test				#generated all possibe log entries
diagnose test application dnsproxy 6	#shows the IP addresses of FQDN objects
diagnose debug crashlog read	#shows crashlog, a status of 0 indicates a normal close of a process!


General Network Troubleshooting

Which is basically ping and traceroute:

execute ping-options ?
execute ping-options source <ip-address-of-the-interface>
execute ping <hostname|ip>
execute ping6-options ?
execute ping6 <hostname|ip>
execute traceroute <hostname|ip>
execute tracert6 <hostname|ip>


Routing

get router info routing-table all	#routing table
get router info6 routing-table		#IPv6 without the "all" keyword
get router info kernel				#Forwarding Information Base
get router info6 kernel
get router <routing-protocol>		#basic information about the enabled routing protocol
diagnose firewall proute list		#policy-based routing
diagnose firewall proute6 list
diagnose ip rtcache list			#route cache = current sessions w/ routing information


High Availability

diagnose sys ha status
execute ha manage ?					#switch to the CLI of a secondary unit
execute ha manage <device-index>
diagnose sys ha showcsum			#verify the checksum of all synchronized peers


Session Table

Display the current active sessions:

get system session list				#rough view with NAT, only IPv4
diagnose sys session filter clear
diagnose sys session filter ?
diagnose sys session filter dst 8.8.8.8
diagnose sys session filter dport 53
diagnose sys session list


Sniffer

Sniff packets like tcpdump does. This can be used for investigating connection problems between two hosts. (There are no details of the firewall policy decisions. Use the debug flow (next paragraph) for anaysis about firewall policies, etc.)

diagnose sniffer packet <interface|any> '<tcpdump-filter>' <verbose> <count> <time-format>

with:

verbose:
1: print header of packets
2: print header and data from ip of packets
3: print header and data from ethernet of packets (if available)
4: print header of packets with interface name
5: print header and data from ip of packets with interface name
6: print header and data from ethernet of packets (if available) with intf name
count: number of packets
time-format:
a: UTC time
l: local time

Examples:

diagnose sniffer packet any 'host 8.8.8.8' 4 4 l
diagnose sniffer packet any 'host 8.8.8.8 and dst port 53' 4 10 a
diagnose sniffer packet wan1 'dst port (80 or 443)' 2 50 l


Flow

If you want to see the FortiGate details about a connection, use this kind of debug. E.g., it shows the routing decision and the policy, which allowed the connection.

diagnose debug reset
diagnose debug flow filter ?
diagnose debug flow filter saddr 172.16.27.148
diagnose debug flow filter daddr 8.8.8.8
diagnose debug flow show console enable
diagnose debug enable
diagnose debug flow trace start 10	#display the next 10 packets, after that, disable the flow:
diagnose debug disable

Example:

fd-wv-fw04 # diagnose debug reset

fd-wv-fw04 # diagnose debug flow filter daddr 8.8.8.8

fd-wv-fw04 # diagnose debug flow show console enable
show trace messages on console

fd-wv-fw04 # diagnose debug enable

fd-wv-fw04 # diagnose debug flow trace start 20
id=20085 trace_id=11 func=print_pkt_detail line=4420 msg="vd-root received a packet(proto=17, 192.168.160.10:55859->8.8.8.8:53) from fg-trust. "
id=20085 trace_id=11 func=init_ip_session_common line=4569 msg="allocate a new session-0001f004"
id=20085 trace_id=11 func=vf_ip4_route_input line=1596 msg="find a route: flags=00000000 gw-172.16.1.1 via wan1"
id=20085 trace_id=11 func=fw_forward_handler line=671 msg="Allowed by Policy-16:"
id=20085 trace_id=11 func=__ip_session_run_tuple line=2601 msg="run helper-dns-udp(dir=original)"
id=20085 trace_id=12 func=print_pkt_detail line=4420 msg="vd-root received a packet(proto=17, 192.168.160.10:63624->8.8.8.8:53) from fg-trust. "
id=20085 trace_id=12 func=init_ip_session_common line=4569 msg="allocate a new session-0001f005"
id=20085 trace_id=12 func=vf_ip4_route_input line=1596 msg="find a route: flags=00000000 gw-172.16.1.1 via wan1"
id=20085 trace_id=12 func=fw_forward_handler line=671 msg="Allowed by Policy-16:"
id=20085 trace_id=12 func=__ip_session_run_tuple line=2601 msg="run helper-dns-udp(dir=original)"

fd-wv-fw04 # diagnose debug disable


VPN

To show details about IKE/IPsec connections, use these commands:

get vpn ike gateway <name>
get vpn ipsec tunnel name <name>
get vpn ipsec tunnel details
diagnose vpn tunnel list
get router info routing-table all

And to debug IKE/IPsec sessions, use the VPN debug:

diagnose debug reset
diagnose vpn ike log-filter clear
diagnose vpn ike log-filter ?
diagnose vpn ike log-filter dst-addr4 1.2.3.4
diagnose debug app ike 255		#shows phase 1 and phase 2 output
diagnose debug enable			#after enough output, disable the debug:
diagnose debug disable


Log

For investigating the log entries (similar to the GUI), use the following filters, etc.:

execute log filter reset
execute log filter category event
execute log filter field			#press enter for options
execute log filter field dstport 8001
execute log filter view-lines 1000
execute log filter start-line 1
execute log display


Links

MRTG/Routers2: Template FortiGate

$
0
0
fd-wv-fw04.cfg-172.16.1.6_connections-ws-l2-r1

A few weeks ago I constructed an MRTG/Routers2 template for the Fortinet FortiGate firewalls. I am using it for monitoring the FortiGate from my MRTG/Routers2 server. With the basic MRTG tool “cfgmaker” all graphs for the interfaces are generated automatically. My template is an add-on that appends graphs for CPU, memory, and disk usage, as well as connections and VPN statistics. Furthermore, it implements the ping statistics graph and a “short summary”, which only shows the system relevant graphs.

Similar to all my other MRTG/Routers2 templates I constructed the configuration lines after investigating the MIBs from Fortinet via the MIB Browser. The MIBs can be downloaded directly from the FortiGate GUI under System -> Config -> SNMP. Great.

Note that this template is built upon a single vdom environment. I was running a FortiWiFi 90D with FortiOS v5.2.4, build688. Depending on the number of vdoms or processors, some of the OIDs in the template must be adjusted, e.g. the CPU usage or the VPN statistics.

cfgmaker Configuration

The first step is the generation of the basic *.cfg file for MRTG/Routers2. It adds all currently known interfaces from the FortiGate with their names. (Even the “zone” interfaces as well as the VPN IPsec tunnel interfaces, which is great!) Note that I am using a few more options such as the “show-op-down” or other global options. Please use Google if you don’t know their meaning. 😉

sudo cfgmaker --snmp-options=:::::2 --show-op-down --zero-speed=100000000 --global "routers.cgi*Icon: firewall3-sm.gif" --global "routers.cgi*GraphStyle[_]: mirror" --output=NAMEOFTHEFIREWALL.cfg COMMUNITY@IPADDRESS

You can delete all global options (expect the ones just created with the cfgmaker command) within the cfg file because they are not needed if running Routers2.

Template

The following template adds the OIDs/graphs for the usage of the CPU, memory, and disk. It also shows the connections (All and IPv6) as well as the VPN stats. (Note that the MIB allows for even more stats such as byte counts for each policy or counts for AV/IPS/whatever features. However, I have not implemented them here.) I am using the same coloring style as in all my other MRTG/Routers2 templates.

You can download my *.cfg template and follow the first comments inside the file which give hints about what to change (search and replace) in order to make the configuration usable for your environment:

Sample Graphs

After all, these graphs are generated:

CPU Memory Disk Usage Connections (All & IPv6) VPNs Normal Interface Statistics Ping Times

Especially, I am loving the connections graphs, which show the count for all (=IPv4 and IPv6) and IPv6-only connections. Great for a comparison of both protocols.

Tufin SecureTrack: Adding Devices

$
0
0
Tufin SecureTrack - Adding Devices featured image

Since a few weeks I am using Tufin SecureTrack in my lab. A product which analyzes firewall policies about their usage and their changes by administrators (and much more). Therefore, the first step is to connect the firewalls to SecureTrack in two directions: SSH from SecureTrack to the device to analyze the configuration, as well as Syslog from the device to SecureTrack to real-time monitor the policy usage.

This blog post shows the adding of the following firewalls into Tufin: Cisco ASA, Fortinet FortiGate, Juniper ScreenOS, and Palo Alto PA.

I am running TufinOS 2.10 on a virtual machine. The Tufin Orchestration Suite (SecureTrack, etc.) is version R15-3.

Pre Note: No IPv6

Though the Tufin appliance can be configured with an IPv6 address, it is not able to communicate with firewalls via IPv6. All connections must traverse via the legacy Internet Protocol. I asked the Tufin support about that, which replied with: “It is not part of the current IPv6 plans, nor any road-map we are aware of.” Oh oh. At least IPv6 network objects can be analyzed, which is the main part of using SecureTrack. For the other features, I mailed a few feature requests to Tufin.

Start monitoring a new device

The configuration steps to add a new device are always the same. Under Settings -> Monitoring -> Manage Devices, select the device type under “Start monitoring a new device” and continue. Give the device a name and set the IP address to which Tufin should connect to. Since I am running OSPF as well as OSPFv3 between all of my firewalls, I am always enabling the “Collect dynamic topology information” feature. Finally, enter the login credentials for connecting via ssh to the firewall. I am always creating a new read-only user for Tufin. The “Monitoring Settings” configuration can be left as default.

The second step is to send syslog messages from each device to Tufin. This is solely done at the firewalls. Of course, all intermediate routers/firewalls must allow the traffic for ssh and syslog between Tufin and the monitored devices.

Cisco ASA

These are the steps for connecting to a Cisco ASA firewall via ssh and syslog. (ASA 5505, 9.2(4)).

Tufin add Cisco ASA (1) Tufin add Cisco ASA (2) Tufin add Cisco ASA (3) Tufin add Cisco ASA (4) Tufin add Cisco ASA (5) Tufin add Cisco ASA (6) Tufin add Cisco ASA (7) Currently logged in administrators. Tufin add Cisco ASA (9) Tufin add Cisco ASA (10) Tufin add Cisco ASA (11) Tufin add Cisco ASA (12) Tufin add Cisco ASA (13)

Fortinet FortiGate

The ssh connection for a FortiGate is configured through the GUI. (FortiWiFi 90D, v5.2.4, build688).

Tufin add FortiGate (1) I created a new admin profile called "read-only". Tufin add FortiGate (3) Tufin add FortiGate (4) Tufin add FortiGate (5) Tufin add FortiGate (6) Tufin add FortiGate (7) Admin logins.

Since I am already using a syslog-ng server, and since only one syslog server is configurable through the FortiGate GUI (oh Fortinet, why aren’t you improving your GUI?), this must be done via the CLI:

config log syslogd2 setting
    set status enable
    set server "192.168.120.19"
end


Juniper ScreenOS

The SSG firewalls are listed as “Juniper NetScreen” within Tufin. These are the steps. (SSG 5, 6.3.0r20.0).

Tufin add Juniper NetScreen (1) Tufin add Juniper NetScreen (2) Tufin add Juniper NetScreen (3) Tufin add Juniper NetScreen (4) Tufin add Juniper NetScreen (5) Tufin add Juniper NetScreen (6) Tufin add Juniper NetScreen (7) Current Login Sessions. Tufin add Juniper NetScreen (9) Tufin add Juniper NetScreen (10)

Palo Alto PA

Finally, the Palo Alto. Note that every security policy rule needs the log forwarding profile attached. Furthermore, the “Config” log messages can be sent to Tufin, too. (PA-200, PAN-OS 7.0.3).

Tufin add Palo Alto (1) Tufin add Palo Alto (2) Tufin add Palo Alto (3) Tufin add Palo Alto (4) Tufin add Palo Alto (5) Tufin add Palo Alto (6) Tufin add Palo Alto (7) Tufin add Palo Alto (8) Tufin add Palo Alto (9) Tufin add Palo Alto (10) Log Forwarding Profile in EVERY security policy rule. See the icons on all lines. Tufin add Palo Alto (13)

Verifying Syslog

If you want to have the rule and object usage analysis, it is crucial that Tufin receives syslog messages. But after adding a new monitored device, the appropriate icon turns green even though no syslog messages are received yet. Only after some time it will get yellow to warn that “Usage data is not being saved”, if there is no receiving of syslog messages.

If you want to verify that syslog messages are received by Tufin, use tcpdump from the CLI:

[root@jw-tufin01 ~]# tcpdump -i eth0 -vv -w /tmp/syslog.log  -s 1500 src 192.168.86.1 and udp dst port 514
tcpdump: listening on eth0, link-type EN10MB (Ethernet), capture size 1500 bytes
Got 662

Note that it is not relevant that the syslog messages come in from the same source IP address as the device is connected. Under certain circumstances, this can be the case. (E.g., I am connecting to my Juniper firewall via a different vrouter interface than the syslog messages are generated.) Tufin matches the received syslog messages to the correct device.

After some hours/days/weeks of information beeing processed by Tufin SecureTrack, you can analyse the configuration or run certain rule and object policy usage reports.

Where to terminate Site-to-Site VPN Tunnels?

$
0
0
Where to terminate Site-to-Site VPN Tunnels - featured image

When using a multilayer firewall design it is not directly clear on which of these firewalls remote site-to-site VPNs should terminate. What must be considered in such scenarios? Differentiate between partners and own remote offices? Or between static and dynamic peer IPs? What about the default routes on the remote sites?

Following is a discussion about different approaches and some best practices. Since not all concepts work with all firewall vendors, the following strategies are separated by common firewalls, i.e., Cisco ASA, Fortinet FortiGate, Juniper ScreenOS, Palo Alto.

Of course, if there is only a single firewall in place, this discussion is not necessary at all. All VPN tunnels must solely terminate on this single firewall. You’re done. But most customers have at least a two-firewall strategy which is not a bad idea at all. While the first firewall is merely for stopping all unused IP connections and for allowing connections to the DMZ, the second firewall has next-gen features such as APT scanning, URL filtering, user recognition, etc. Normally, both firewalls have a default route directed to the Internet (if no proxies are used).

Multilayer Firewall


Who has a Static S2S Tunnel?

  • Remote Offices: Locations that are owned by the same company. Mostly coming from static IP addresses. If the remote office has no local Internet breakout, it has a default route back to the headquarter. That is: all Internet traffic must be processed by the second, next-generation firewall (or web-proxy). The network behind this remote office can be considered as internal, but on another location. It should be treated in the same way os other internal traffic.
  • Home Offices: Users that are working from home. Normally coming from dynamic IP addresses. No local Internet breakout -> all traffic must traverse through the second NGFW, too. (I.e., same as “remote office”, but from a dynamic IP address.)
  • Partners: Other companies that must access certain services in the DMZ (such as servers or proxies). Almost coming from static IP addresses. No routing/ACLs for accessing the internal networks are required. That is: This traffic must not go through the second firewall.

The Problems

  1. The first firewall has a default route to the Internet. Otherwise, no connections could be made from/to the firewall at all.
  2. But for the remote- and home-offices, the traffic coming out of the VPN-interface need a default route to the second firewall (and not directly to the Internet). If all VPNs are terminated on the first firewall, this is not the case. -> The best approach is to have an own routing instance for the tunnel-interfaces with a default route to the second firewall.
  3. Only a few firewall appliances implement the concept of “virtual routers” (Juniper ScreenOS, Palo Alto). For the FortiGate, policy-based forwarding can be used. For the Cisco ASA, none of these concepts work. Only a workaround can be used there (if it is not an option to buy a better firewall).

(Note that for some remote access VPN solutions, it is default to have two virtual routers / routing tables in the box. This is true, for example, for the Pulse Secure, formerly Juniper SA/MAG. With these devices, traffic coming out from the VPN has another default route than Internet traffic with its default route to the Internet.)

All following concepts describe the case in which the first firewall is from vendor X. It is not related to the second firewall.

Concept 1: Two Virtual Routers on the first firewall (Juniper, Palo Alto)

Both firewall vendors (Juniper ScreenOS and Palo Alto) have virtual routers implemented. That means, the “tunnel-interface” for the VPN can be on another virtual router with another default route. While the default virtual router can point to the Internet (for all outgoing connections and for terminating the VPN), the second virtual router (with the tunnel-interface in it) can point to the second firewall.

Concept 1 - two VRs


Concept 2: Policy-Based Routing/Forwarding (FortiGate)

Unluckily, the FortiGate has not virtual routers, but only virtual domains (vdoms). This is great for separating firewall instances, but does not solve the VPN problem here. However, it is possible to configure a policy route: All traffic coming out of the tunnel-interface has a “new” default route to the second firewall.

Concept 2 - PBR


Concept 3: Partners on First, Remote Office on Second Firewall (Cisco ASA)

Cisco ASA has neither virtual routers nor policy-based routing. The only “concept” is to terminate the partners on the Cisco ASA and to allow the remote offices to access the second firewall for VPN termination. That is, the static IP addresses from the remote offices must be allowed in an ACL on the Cisco ASA to reach the second firewall directly. Note that it is NOT recommended to allow “from any” to the second firewall, which means that VPN connections from home offices (coming from dynamic IP addresses) will not work in this scenario. That’s definitely a major drawback.

Concept 3 - VPN on both Firewalls


Any Comments?

Please write a comment if I missed something or if you disagree with one of these concepts. Thanks a lot.

ntopng Installation

$
0
0
ntopng Installation featured image

Some time ago I published a post introducing ntopng as an out-of-the-box network monitoring tool. I am running it on a Knoppix live Linux notebook with two network cards. However, I have a few customers that wanted a persistent installation of ntopng in their  environment. So this is a step-by-step tutorial on how to install ntopng on a Ubuntu server with at least two NICs.

I already pointed to the many great features of ntopng in the previous post. If you are searching for an open source real-time network analyzer, ntopng is the choice.

Network Setup

This is a rough view of the network. On a switch in the network, a monitor port is configured to send all traffic from a certain port/vlan/routing-domain to the network analyzer. (There are different names for this scenario: mirror and monitor ports, SPAN ports, source and destination ports, etc.) The eth1 port on the Linux machine is used in promiscuous mode to process everything that comes in.

The other port, eth0, must be configured with a static IP address on the network. Through this port, the ntopng GUI (IP-address with default port 3000) appears.

ntopng Installation

Plan the place and bandwidth of the mirroring carefully! Before or after a firewall/router with NAT? Does the overall bandwidth exceed the physical link of the monitor port?

Installation of ntopng

I am using a fresh Ubuntu Server 14.04 LTS edition (64-bit <- which is required for ntopng). As always I am installing a few basic software packages before starting with the actual service. The packages for ntopng can be found here. Select either the “nightly” or “stable” builds. For more reliable versions, you should choose the stable one. Execute the following two commands on the server to add the repository of ntopng:

wget http://apt-stable.ntop.org/14.04/all/apt-ntop-stable.deb
sudo dpkg -i apt-ntop-stable.deb

Have a look at “/etc/apt/sources.list.d/”. There is now a “ntop-stable.list” file which has two lines. Now you can install ntopng with:

sudo apt-get update
sudo apt-get install ntopng

This will install a bunch of packages, incuding ntopng, ntopng-data, pfring, redis-server, redis-tools.

Before you can start ntopng, you need to create a configuration file:

sudo nano /etc/ntopng/ntopng.conf
  . Read the documentation (
man ntopng
 ) for more details. The following template can be used as a starting point:
--pid-path=/var/tmp/ntopng.pid
--daemon
--interface=eth1
--http-port=3000
--local-networks="10.0.0.0/8,192.168.0.0/16,2001:db8::/48"
--dns-mode=1
--data-dir=/var/tmp/ntopng
--disable-autologout
--community

Furthermore, you need a file called “ntopng.start”, which can be empty but must exist in the folder:

sudo touch /etc/ntopng/ntopng.start

Now you can start ntopng with:

sudo service ntopng start

It will also be started automatically after a reboot.

Promiscuous Interfaces

What’s still missing is the configuration of the eth1 interface to be in promisc mode. Furthermore, it should not get an IPv4 or IPv6 via DHCPv4 or SLAAC. Therefore, the following configuration steps are required.

Disable IPv6 on the interface: Open the following file:

sudo nano /etc/sysctl.conf

and add the following line:

net.ipv6.conf.eth1.disable_ipv6=1


Start the eth1 interface in promiscuous mode: Open the following file:

sudo nano /etc/network/interfaces

and add these lines:

auto eth1
iface eth1 inet manual
        up ifconfig eth1 promisc up
        down ifconfig eth1 promisc down

Note: If there are already some lines that reference to eth1, delete them or comment them out. For example, there should be no “iface eth1 inet dhcp” line anymore!


Now, after each reboot of the server, the eth1 interface card will be in promiscuous mode and ntopng will be started automatically.

To verify that ntopng is running, have a look at netstat, which should display the running process and the open TCP port 3000:

weberjoh@jw-nb10:/etc/ntopng$ sudo netstat -l -p -n
Active Internet connections (only servers)
Proto Recv-Q Send-Q Local Address           Foreign Address         State       PID/Program name
tcp        0      0 127.0.0.1:6379          0.0.0.0:*               LISTEN      1280/redis-server 1
tcp        0      0 0.0.0.0:22              0.0.0.0:*               LISTEN      1110/sshd
tcp6       0      0 :::22                   :::*                    LISTEN      1110/sshd
tcp6       0      0 :::3000                 :::*                    LISTEN      8543/ntopng
udp        0      0 192.168.120.10:123      0.0.0.0:*                           1729/ntpd
udp        0      0 127.0.0.1:123           0.0.0.0:*                           1729/ntpd
udp        0      0 0.0.0.0:123             0.0.0.0:*                           1729/ntpd
udp        0      0 0.0.0.0:161             0.0.0.0:*                           1307/snmpd
udp        0      0 0.0.0.0:58820           0.0.0.0:*                           1307/snmpd
udp        0      0 0.0.0.0:514             0.0.0.0:*                           1236/syslog-ng
udp6       0      0 2003:51:6012:120::1:123 :::*                                1729/ntpd
udp6       0      0 fe80::21d:92ff:fe53:123 :::*                                1729/ntpd
udp6       0      0 ::1:123                 :::*                                1729/ntpd
udp6       0      0 :::123                  :::*                                1729/ntpd
udp6       0      0 ::1:161                 :::*                                1307/snmpd


FortiGate: Software-/ Hardware-/ VLAN-Switch

$
0
0
FortiGate Switch Modes

I am still a bit confused about the different switch types a FortiGate firewall is able to handle. While there are a lot of information on the Internet about the “internal-switch-mode” of “switch/interface“, I have not found any good information about the differences between the “Hardware/Software/VLAN” switch types that are configured via the GUI or via the “virtual-switch-vlan enable” CLI command. Though I still don’t know exactly all differences, I am trying to explain some of them here.

Possibilities

This table lists the possible switch types. The first column shows the configured switch mode (

set internal-switch-mode {interface|switch}
 ), the second is the VLAN switch mode (
set virtual-switch-vlan {enable|disable}
 ), and the last column shows the possible switch types that can be configured within these scenarios (software, hardware, VLAN):
Switch Mode
set internal-switch-mode ...
VLAN Switch Mode
set virtual-switch-vlan ...
Switch Types
switchdisableSoftware Switch
switchenableSoftware Switch
interfacedisableHardware Switch
Software Switch
interfaceenableVLAN Switch
Software Switch

Mode: Switch or Interface

This is explained on many pages on the Internet and even on some official Fortinet documentations such as here. Mostly, you want the “interface” mode in which you can configure every interface on a FortiGate to be an unique layer-3 interface. Currently, when a FortiGate is factory reset, the default is “interface” mode:

config system global
    set internal-switch-mode interface


Type: Software, Hardware, or VLAN

Now it’s getting a bit more interesting. As we have seen already, the software switch is present in any scenario, while the other ones are only possible in the “interface” mode. In any case, each created switch type must be configured with an IP address.

  • Software Switch: This is a logical (!) bound of interfaces of different types. It can be used if physical interfaces and WiFi interfaces/SSIDs/etc. should be bound together. (I am not sure, but it sounds like this switch type is controlled merely by the CPU. Maybe it’s not that fast compared to the hardware switch?)
  • Hardware Switch: A hardware switch bounds hardware interfaces together that are physically present on the same integrated switch. This is hardware dependent. Not all FortiGate firewalls can be configured in the same way for hardware switches.
  • VLAN Switch: This is a type of hardware switch that adds the VLAN ID to it. With this feature it is possible to create a hardware switch within an already present VLAN on the network. This VLAN can be connected through another interface port in trunk mode to transport this VLAN to some other layer-2 switches.

I hope this bring a bit more understanding? Please write a comment if I missed something or explained something wrong.

FortiGate HA Cluster

$
0
0
FortiGate HA featured image

This is a step-by-step tutorial for configuring a high availability cluster (active-standby) with two FortiGate firewalls. Since almost all firewall vendors have different principles for their HA cluster, I am also showing a common network scenario for Fortinet.

I am using two FortiWiFi 90D firewalls with software version v5.2.5,build701. The official Fortinet documentation for “High Availability with two FortiGates” can be found here.

Network Layout

FortiGate HA NetworkBasically, all interfaces must be connected with layer-2 switches among both firewalls. (In my lab, these are the wan1 and internal1 ports.) Furthermore, two directly connected interfaces should be used for the HA heartbeats. If the firewall has no dedicated HA interfaces, any unused interfaces can be used instead. (In my lab, I am using ports internal13 and internal14 for the heartbeats on my FortiWiFi-90D firewalls.)

The crucial point is the out-of-band management for accessing both firewalls independent of their HA state. Fortinet has the feature of the “Management Port for Cluster Member“, which must be set during the initial HA process. This interface must be unused to that point and can be configured later with an IP address within the same IP subnet as an already used interface. (In my lab, I am using the internal12 ports for the management ports.)

Screenshot Guide

Note: Before cabling the HA cluster, you should configure both units and then power off (!) the secondary one. Then connect the HA heartbeat interfaces and power on the secondary unit again. This ensures that the primary unit will stay the primary (since it has the longer uptime) and syncs its configuration to the secondary one.

Following are the screenshots for this HA cluster guide. Note the descriptions under each screenshot:

Set the HA Mode to "Active-Passive", reserve an unsused (!) port for cluster management and set all other cluster settings such as the heartbeat interfaces and port monitors. After applying the HA mode, some network outages is present on the complete FortiGate unit. Configure an IP address on the cluster management port just set. This can be in the same IP range than another routed subnet, as seen in the screenshot. On the second unit, configure almost the same HA settings. And give the cluster management port an other (!) IP address than the primary one. If both cluster management IP addresses should be accessible through routed interfaces, a SNAT must be used to route the traffic correctly. Both firewalls can now be accessed via its new IP addresses. This is master unit. And this is the slave unit. Summary of the HA Cluster.

The following two pictures show the physical units after the HA configuration. On the first picture, the HA cluster was not cabled, while on the second, it was. Note the green HA LED:

HA Cluster configured but not cabled. HA Cluster works correctly.

Via the CLI, the

diagnose ha sys status
  command can be used to investigate the cluster:
fd-wv-fw04b $ diagnose sys ha status
HA information
Statistics
        traffic.local = s:0 p:18860 b:1708434
        traffic.total = s:0 p:19031 b:1726842
        activity.fdb  = c:0 q:0

Model=90, Mode=2 Group=0 Debug=0
nvcluster=1, ses_pickup=1, delay=0

HA group member information: is_manage_master=0.
FWF90D3Z13005629, 1.  Slave:128 fd-wv-fw04b
FWF90D3Z13006159, 0. Master:128 fd-wv-fw04

vcluster 1, state=standby, master_ip=169.254.0.1, master_id=0:
FWF90D3Z13005629, 1.  Slave:128 fd-wv-fw04b(prio=1, rev=0)
FWF90D3Z13006159, 0. Master:128 fd-wv-fw04(prio=0, rev=255)


Network Transfer: 1 Big vs. 100 Small Files

$
0
0
Network Transfer featured image

A common mistake when analyzing network speed/bandwidth between different applications and servers is to fully rely on the mere size of the files being transferred. In fact, one big file will transfer much faster than thousands of small files that have the same accumulated size. This depends on the overhead of reading/writing these files, building TCP/IP sessions, scanning them for viruses, etc. Furthermore, it is application dependent.

I built a small lab with an FTP server, switch, firewall, and an FTP client in which I played a bit with different file sizes. In this blog post I am showing the measured transfer times and some Wireshark graphs.

Lab

This simple lab consists of the following components:

  • Notebook, Windows 7, FileZilla FTP Server
  • Fortinet FortiGate Firewall (FortiWiFi 90D version 5.2.5) with activated “next-gen” features such as AntiVirus and Application Control. Furthermore, a destination NAT (Virtual IP) was used for the FTP server.
  • Dell Switch, unmanaged, 1 GBit/s
  • Notebook, Windows 7, FileZilla FTP Client
  • The lab was IPv4-only. The cabling was the following:
    FTP server <-> FortiGate <-> switch <-> FTP client
  • The Wireshark graphs were generated with Wireshark version 2.0.1.

I tested the following scenarios:

That is, in every case, I transferred 100 MBytes but with 1 vs. 100 files in summary. Here are some screenshots of the file properties as well as the FortiGate settings and CPU usage during the tests:

1 big file 100 small files FortiGate Policy (second line). CPU Usage during the tests. FortiGate Logs during the small tests (1 MB files).

Results

These are the measured transfer times:

  • 1 big file: 15,2 seconds = 52,6 MBit/s
  • 100 small files: 37,7 seconds =  21,2 MBit/s

And, more interesting, the corresponding IO graph from Wireshark which shows the transfer of both tests. The first block is the big file while the second block shows the large variance caused by the many small files:

1big-vs-100small-files-ftp-0,1s-Bit

The Wireshark Conversations list shows the TCP connections for both tests which reveal that the total amount of bytes for the first test was 109 M (yellow) while every small file took about 1130 k (green):

Network Transfer 06 Wireshark Conversations

Finally, the Time Sequence (tcptrace) for the first 100 M file shows an almost perfect rise (with one exception, first three images) while three sample graphs of some small files show the variance of the transfers:

Big file summary Big file zoomed in Big file delay One small file Another small file And another small file

Conclusion

It depends! It depends on many factors whether a file transfer over the “fast layer 2 / layer 3 infrastructure” is in fact fast or not. If FTP is used for many backup jobs, a few firewalls are in between, and the streams are in parallel with many small files, the network throughput might decrease dramatically.

FortiGate VPN Speedtests

$
0
0
FortiGate VPN Speedtests featured image

Triggered by a customer who had problems getting enough speed through an IPsec site-to-site VPN tunnel between FortiGate firewalls I decided to test different encryption/hashing algorithms to verify the network throughput. I used two FortiWiFi 90D firewalls that have an official IPsec VPN throughput of 1 Gbps. Using Iperf I measured the transfer rates with no VPN tunnel as well as with different IPsec proposals.

I first ran into really slow performances which were related to the default “Software Switch” on the FortiGate. After deleting this type of logical switch, the VPN throughput was almost as expected.

Lab

My lab consists of the following components:

FortiGate VPN Speedtests Labor

Both FortiWiFi 90D firewalls had the firmware version v5.2.5, build701. The two notebooks were booted with Knoppix 7.6.1 and used Iperf version 2.0.5. The “left” machine ran as the server with either:

iperf -s
iperf -s -u

while the “right” machine started Iperf with the following commands for different TCP and UDP tests:

iperf -c 192.168.10.10 -r
iperf -c 192.168.10.10 -r -P 8
iperf -c 192.168.10.10 -r -u -b 1000M


I tested the throughput without a VPN at all (only routing) and with a few different proposals (see table below). The Diffie-Hellman group for PFS was always set to 14. This is not related to the test results because it is only used for the key establishment and not for the actual symmetric encryption of the traffic.

I also switched the offloading of encryption to “enable” (refer to the Hardware Acceleration Guide), which did not change anything, either.

config system npu
    set enc-offload-antireplay enable
end


Furthermore, I tested the differences between a normal TCP test and the manual set of the TCP window size and buffer length with “-w 512k -l 512k”, such as shown here or here. But this made no differences, too, since Knoppix Linux seems to auto set the window size pretty optimal.

Results

These are the results. The first four tests are without a VPN. While the first two are without routing (simply plugged in both clients into the same software switch on the FortiGate), tests 3 & 4 are routed through the FortiGates. This was the first time at which I was really shocked about the bad performance of only 180 Mbit/s routing speed. Furthermore, almost all IPsec proposals ran at a speed of 86 MBit/s, which is only 9 % of the IPsec throughput listed in the data sheet.

ProposalsTCP
Tx/Rx
[MBit/s]
TCP
Tx/Rx
[MBit/s]
UDP
Tx/Rx
[MBit/s]
IPerf Options-r-r -P 8-u -r -b 1000M
Same Software Switch
H - FGSW - H
942/937941/936807/805
Same Software Switch
+ Hardware Switch
H - FGSW - SW - H
942/936941/936807/804
No VPN, only Routing
FortiGate directly
H - FG - FG - H
155/177151/168211/206
No VPN, only Routing
H - FG - SW - FG - H
155/177152/168211/210
DES-MD586/8683/8293/94
3DES-MD586/8683/8393/94
3DES-SHA186/8683/8395/94
AES128-SHA186/8683/8388/87
AES256-SHA25686/86122/13393/93
AES256-SHA51285/8580/8084/92

The software switch was the problem!

After hours of investigating the slow VPN speed results, I tested the VPN without the software switch on the network ports side, which led to the following results (first column with a “Hardware Switch”, second column with a single interface):

ProposalsHardware Switch
TCP
Tx/Rx
[MBit/s]
Single Interface
TCP
Tx/Rx
[MBit/s]
Iperf Options-r-r
No VPN, only Routing
H - FG - SW - FG - H
937/937933/932
DES-MD5852/840845/839
3DES-SHA1707/642701/634
AES128-SHA1825/835826/830
AES256-SHA1820/830816/825
AES256-SHA256723/819814/825
AES256-SHA512637/808812/810

Now the speed was quite acceptable, for the mere routing as well as for the VPN throughput. 940 MBit/s for routing through both FortiGate is almost realistic for TCP, and about 830 MBit/s for VPN encryption/decryption is realistic, too.

Here are the “single interface” results in a graph. Only the 3DES tests are a bit slower than all the other ones:

Conclusion

Well, it was my fault that I left the default software switch in place. I should have know better. However, it was the default setting on this FortiWiFi devices.

At the end, the VPN throughput between those FortiGates was really acceptable.

FRITZ!Box VPN Speedtests

$
0
0
Fritzbox VPN Speedtests featured image

Ähnlich zum dem Site-to-Site VPN Throughput Test der FortiGate Firewalls wollte ich mal den FRITZ!Boxen auf den Zahn fühlen und herausfinden, in wie fern sich der VPN-Durchsatz bei den Modellen unterscheidet, bzw. welche Rolle die ausgewählten Verschlüsselungsverfahren spielen. Getestet habe ich eine (etwas ältere) FRITZ!Box 7270v3 mit FRITZ!OS 06.06 sowie eine (neuere, obgleich nicht Topmodell) FRITZ!Box 7430 in Version 06.30. Als VPN-Endpunkt auf der Gegenseite habe ich eine FortiGate Firewall genommen. Getestet wurde das reine Routing/NATting sowie verschiedene Phase 2 Proposals mit dem Netzwerk Tool Iperf.

Ein paar mehr Details bezüglich des Testaufbaus kann man in dem vorherigen Artikel von mir durchlesen. Hier wurde nur die eine FortiGate als Router umfunktioniert und dahinter die jeweilige FRITZ!Box gesetzt. Auf den Testnotebooks lief wieder Knoppix.

Labor

Folgende Einstellungen nahm ich auf der FRITZ!Box vor:

  • Internetzugang über LAN 1, Internetverbindung selber aufbauen
  • Übertragungsgeschwindigkeit auf 100.000 kbit/s für beide Richtungen gesetzt
  • Portfreigabe “Exposed Host” an Test-Client IP
  • WLAN deaktiviert
  • VPN zur FortiGate gemäß dieser Vorlage aufgebaut
  • An der FortiGate zwischen 3DES und AES256 in Phase 2 manuell gewechselt, bzw. auch mit “nur Routing” ohne VPN getestet.

Logisch sah das Labor dann so aus:

Firtzbox VPN Speedtests Labor

Physikalisch in etwa so: 😉

Fritzbox VPN Speedtests Labor physikalisch

Testergebnisse

Dies waren meine Testergebnisse (TCP):

Bzw. in Rohform (TCP und UDP):

ModellPhase 2
Proposal
TCP
Tx/Rx
[MBit/s]
UDP
Tx/Rx
[MBit/s]
IPerf Optionen-r-u -r -b 100M
7270v3
06.06
Kein VPN, nur Routing70/6596/94
3DES5,2/5,22,5/0,1
AES2569,4/9,85,5/0,1
7430
06.30
Kein VPN, nur Routing94/9496/96
3DES6,7/6,45,2/0,5
AES25614,6/15,59,1/10,7

Ohne VPN liefert die 7270 einigermaßen gute Ergebnisse. Zumindest beim UDP Tests waren die Maximalergebnisse (96 MBit netto) sehr gut. Beim Einsatz eines VPNs raucht die Geschwindigkeit aber total ab. Das Maximum war bei einer AES256 Verschlüsselung mit 10 MBit herauszuholen. Warum beim UDP Test der Rückweg nur 0,1 MBit liefert, kann ich nicht beurteilen.

Die 7430 liefert beim reinen Routing/NAT Test starke Werte um die 95 MBit. Aber auch sie knackt beim VPN-Durchsatz Test stark ein. Maximal 15 MBit bei der Verwendung von AES256 waren drin.

Fazit

Gerne wird die FRITZ!Box im privaten als auch im semi-professionellen Umfeld nicht nur als Internet-Router, sondern auch als VPN-Gateway eingesetzt. Ungeachtet der Tatsache, dass man im Firmenumfeld sowieso nicht auf ein Privatprodukt setzen sollte, ist der nutzbare VPN-Durchsatz bei knapp 15 MBit/s teilweise deutlich unter den reinen Internetgeschwindigkeiten, die man heute durch VDSL und Glasfaser so bekommt. Daher sollte man sich gut überlegen, wo und wie man die FRITZ!Box dafür einsetzt.

Mangels Hardware konnte ich leider nicht noch das aktuelle Topmodell von AVM, die FRITZ!Box 7490, testen. Da dasVer- und Entschlüsseln der VPNs aber rein in Software/CPU passiert, lässt ein Blick auf Vergleichstabellen der CPUs der Geräte [1, 2, 3] leider nur erahnen, dass auch das Topmodell nur wenig besser sein dürfte, da die Geschwindkeit der CPU nur leicht angehoben wurde.

FortiGate IPv4 vs. IPv6 Performance Speedtests

$
0
0
FortiGate IPv4-vs-IPv6 featured image

I was interested in the performance of my FortiGate firewall when comparing IPv4 and IPv6 traffic. Therefore I built a small lab consisting a FortiWiFi 90D firewall and two Linux clients running Iperf. I tested the network throughput for both Internet Protocols in both directions within three scenarios: 1) both clients plugged into the same “hardware switch” on the FortiGate, 2) different subnets with an “allow any any” policy without any further security profiles, and finally, 3) activating antivirus, application control, IPS, and SSL inspection.

Laboratory

Both clients (notebooks) booted with the live Linux Knoppix in version 7.6.1. The FortiWiFi 90D ran at software version v.5.2.5, build701. The security policies for tests 2 and 3 looked like that:

IPv4 Policy withOUT Security Profiles IPv4 Policy with Security Profiles IPv6 Policy withOUT Security Profiles IPv6 Policy with Security Profiles

I started Iperf on one of the notebooks in server mode (with either IPv4 or IPv6),

iperf -s
iperf -s -V

and ran the other notebook as the client: (Yes, I really used the 2001:db8::/32 for testing purposes this time.)

iperf -c 192.168.47.11 -r
iperf -c 2001:db8:47:0:221:70ff:fee9:bb47 -V -r

A complete run of Iperf is listed in the following:

knoppix@Microknoppix:~$ iperf -c 2001:db8:47:0:221:70ff:fee9:bb47 -V -r
------------------------------------------------------------
Server listening on TCP port 5001
TCP window size: 85.3 KByte (default)
------------------------------------------------------------
------------------------------------------------------------
Client connecting to 2001:db8:47:0:221:70ff:fee9:bb47, TCP port 5001
TCP window size: 43.8 KByte (default)
------------------------------------------------------------
[  5] local 2001:db8:48:0:16fe:b5ff:feb2:3fe8 port 51318 connected with 2001:db8:47:0:221:70ff:fee9:bb47 port 5001
[ ID] Interval       Transfer     Bandwidth
[  5]  0.0-10.0 sec   184 MBytes   154 Mbits/sec
[  4] local 2001:db8:48:0:16fe:b5ff:feb2:3fe8 port 5001 connected with 2001:db8:47:0:221:70ff:fee9:bb47 port 41070
[  4]  0.0-10.2 sec  53.1 MBytes  43.6 Mbits/sec

Here is a screenshot of the FortiGate Traffic Forward log that shows some IPv4 and IPv6 runs:

FortiGate IPv4-vs-IPv6 03 Forward Traffic Log

Results

These are the results:

  1. When plugged into the same hardware switch on the FortiGate unit (no routing, only layer 2), the speed for both protocols was almost the same and very good (around 930 MBit/s).
  2. When routed through the FortiGate, IPv4 had almost the same speed while IPv6 dramatically dropped its rate to about 150-180 MBit/s (yellow and green bars).
  3. With activated antivirus scanning, etc., the Rx path was at about 40 MBit/s which is perfect due to the official data sheets that list 41 Mbit/s for mixed IPS throughput. However, the Tx path was the same for IPv6 with only about 150 MBit/s.

Conclusion

Of course, these results are only true for this single FWF-90D firewall. It only has an NP4-lite processor which is not capable of IPv6. Bigger firewalls with the newer NP6 claim that they have the same speed for IPv4 as for IPv6. Hopefully they will. The measured IPv6 throughput with this firewall is obviously not that good!

Raw Values

 IPv4
Tx/Rx
[MBit/s]
IPv6
Tx/Rx
[MBit/s]
Same Hardware Switch943/936929/924
Routing Without Security Profiles937/936156/182
Policy With Security Profiles929/43154/44

RTTs with different ISPs

$
0
0
Ping-Times-ISP-Routing-Europe featured image

Just a short post this time, but an interesting fact concerning different Internet Service Providers (ISPs) and their routing to/from other countries. I have a customer in Germany that has a remote office in France, connected via a site-to-site VPN. Around April last year the french office decided to change the ISP to a cheaper competitor that offers the same speed/bandwidth and therefore has no disadvantages… Well, I disagree.

The following image, take from MRTG with Routers2 and the mrtg-ping-probe tool, shows the latency (round-trip time, RTT) through the site-to-site VPN connection from the headquarter in Germany to the remote office in France. Obviously, in the mid of April the french office changed the ISP to another one which dramatically increased the RTT. After more than six months, they decided to go back to the old ISP which brought the expected low latency back.

Ping-Times-ISP-Routing-Europe

This is basically an example that the “goodness” of an ISP does not only depend on its bandwidth offered to the customer, but also relies to the routing decisions and peerings to other ISPs, etc. Though the bandwidth was the same, the latency to/from Germany increased from about 400 ms peaks to 2000 ms peaks! You won’t ever work with that latency with Citrix or RDP!

Lessons learned: Prove the whole chain of processes before electing the cheapest ISP.

Viewing all 340 articles
Browse latest View live


<script src="https://jsc.adskeeper.com/r/s/rssing.com.1596347.js" async> </script>