Quantcast
Channel: Weberblog.net
Viewing all 340 articles
Browse latest View live
↧

Scanning SSH Servers

$
0
0

For administrative purposes, SSH is used quite often. Almost everyone in IT knows it. Keywords: OpenSSH, simply using “ssh <hostname>” on your machine, PuTTY for Windows, username + password or public key authentication, TCP port 22, simple firewall rules, ignoring the fingerprints đŸ€Šâ€â™‚ïž, SCP and SFTP. That’s it – basically.

However, it gets much more complicated if you look into the details. You have to deal with many different types and representations of fingerprints, as well as crypto algorithms. Troubleshooting specific connection problems is challenging.

To get an overview of your SSH server’s configuration is to scan them with appropriate tools. I’m showing two of them here: ssh_scan and the Nmap script “ssh2-enum-algos“.

I’m using an Ubuntu 20.04.5 LTS (GNU/Linux 5.4.0-139-generic x86_64) for the following.

mozilla/ssh_scan

“An SSH configuration and policy scanner“. Unfortunately, the GitHub repository has been marked as deprecated. However, you can still install it:

sudo apt install ruby ruby-dev gcc gem
sudo gem install ssh_scan

Usage is simple: ssh_scan -t <hostname|ip>. The output gives you many insights about the keys (along with their fingerprints), the encryption-, mac-, and key-algorithms, SSHFP dns_keys, and so forth. IPv6 is preferred, as it should be.

This is a test run against an Ubuntu 18.04.6 LTS:

weberjoh@vm32-test2:~$ ssh_scan -t test1.weberlab.de
[
  {
    "ssh_scan_version": "0.0.44",
    "ip": "194.247.5.25",
    "hostname": "test1.weberlab.de",
    "port": 22,
    "server_banner": "SSH-2.0-OpenSSH_7.6p1 Ubuntu-4ubuntu0.7",
    "ssh_version": 2.0,
    "os": "ubuntu",
    "os_cpe": "o:canonical:ubuntu",
    "ssh_lib": "openssh",
    "ssh_lib_cpe": "a:openssh:openssh:7.6p1",
    "key_algorithms": [
      "curve25519-sha256",
      "curve25519-sha256@libssh.org",
      "ecdh-sha2-nistp256",
      "ecdh-sha2-nistp384",
      "ecdh-sha2-nistp521",
      "diffie-hellman-group-exchange-sha256",
      "diffie-hellman-group16-sha512",
      "diffie-hellman-group18-sha512",
      "diffie-hellman-group14-sha256",
      "diffie-hellman-group14-sha1"
    ],
    "encryption_algorithms_client_to_server": [
      "chacha20-poly1305@openssh.com",
      "aes128-ctr",
      "aes192-ctr",
      "aes256-ctr",
      "aes128-gcm@openssh.com",
      "aes256-gcm@openssh.com"
    ],
    "encryption_algorithms_server_to_client": [
      "chacha20-poly1305@openssh.com",
      "aes128-ctr",
      "aes192-ctr",
      "aes256-ctr",
      "aes128-gcm@openssh.com",
      "aes256-gcm@openssh.com"
    ],
    "mac_algorithms_client_to_server": [
      "umac-64-etm@openssh.com",
      "umac-128-etm@openssh.com",
      "hmac-sha2-256-etm@openssh.com",
      "hmac-sha2-512-etm@openssh.com",
      "hmac-sha1-etm@openssh.com",
      "umac-64@openssh.com",
      "umac-128@openssh.com",
      "hmac-sha2-256",
      "hmac-sha2-512",
      "hmac-sha1"
    ],
    "mac_algorithms_server_to_client": [
      "umac-64-etm@openssh.com",
      "umac-128-etm@openssh.com",
      "hmac-sha2-256-etm@openssh.com",
      "hmac-sha2-512-etm@openssh.com",
      "hmac-sha1-etm@openssh.com",
      "umac-64@openssh.com",
      "umac-128@openssh.com",
      "hmac-sha2-256",
      "hmac-sha2-512",
      "hmac-sha1"
    ],
    "compression_algorithms_client_to_server": [
      "none",
      "zlib@openssh.com"
    ],
    "compression_algorithms_server_to_client": [
      "none",
      "zlib@openssh.com"
    ],
    "languages_client_to_server": [

    ],
    "languages_server_to_client": [

    ],
    "auth_methods": [
      "publickey",
      "password"
    ],
    "keys": {
      "rsa": {
        "raw": "ssh-rsa AAAAB3NzaC1yc2EAAAADAQABAAABAQDhLLYj+v5tChro3/H0EYUj1sePBEh89Z1IDyQpaxsMNmbXxmt3Q/H26jDlCCIoVUrnsdcYSsa8zRnumRDgb1mGUUs18ri7bQhT+NOfwox/c29VQj7tYCF1tw8LMehn2bhAZgVyUJohsXoAe6Aa8N47aQ8ddCu09DSCBMpbZJgKONqVkc/lYZ+yBhxHUVmCrTjfuX2z3ycM8cJ6pGCsBvzZx2aJXJFmvsNiwjaXJz6rhm0UwP/9haKiC3PCvHwNNMMQfM9yUWm0eRcxtitLw/B51m4aoLpEkomomcwPSBbpPzUWrPtNXWStfFajjr2GFO7NY9AGylV25scjb+YIz2x7",
        "length": 2048,
        "fingerprints": {
          "md5": "42:5a:52:28:d3:f1:6d:bf:22:ba:26:26:2b:65:29:24",
          "sha1": "48:62:51:71:25:04:1d:d1:ea:7f:14:7e:ce:91:1c:0a:21:92:3d:cb",
          "sha256": "ee:70:d2:6e:e3:a5:db:2c:45:e8:6b:43:01:3d:85:8c:83:2b:95:94:ba:93:23:c2:db:19:3b:d4:09:f4:cf:1a"
        }
      },
      "ecdsa-sha2-nistp256": {
        "raw": "ecdsa-sha2-nistp256 AAAAE2VjZHNhLXNoYTItbmlzdHAyNTYAAAAIbmlzdHAyNTYAAABBBPfD/EKxAETdEr8oP1JEuDNj2MZUPNmqakQrzgsqOSirgbDCVDZrjU5Au1aM4k0KzMFRVjTT4jvs64ea45F5SN8=",
        "length": 520,
        "fingerprints": {
          "md5": "08:cc:6a:15:be:a6:0c:6a:ae:0c:0d:87:f2:cb:a4:90",
          "sha1": "5c:db:59:67:1c:30:1e:74:96:a6:87:8d:fe:6c:3f:d0:6c:9a:4f:f5",
          "sha256": "fa:f3:d7:2b:51:69:7e:62:cd:1b:36:f9:d3:86:5b:dc:52:62:da:9f:3a:db:ef:5f:3b:a8:81:7b:2d:15:e8:00"
        }
      },
      "ed25519": {
        "raw": "ssh-ed25519 AAAAC3NzaC1lZDI1NTE5AAAAIICg8/9MH7OjCSDevCKVZY5XBKMInGWb8Jb2Sm7driEI",
        "length": 256,
        "fingerprints": {
          "md5": "97:38:e8:8e:81:83:56:6e:0f:bc:77:06:88:75:37:d3",
          "sha1": "41:09:8f:a4:0e:be:90:f7:38:83:62:ec:40:7e:b2:2c:49:bf:c2:d1",
          "sha256": "76:f2:b1:40:5b:8b:ea:0e:0c:97:6b:20:ce:0a:0b:5d:19:f9:f3:ce:99:bb:24:6d:93:8b:4d:3c:e7:28:ac:44"
        }
      }
    },
    "dns_keys": [
      {
        "fptype": "sha256",
        "algo": "ed25519",
        "hex": "76:f2:b1:40:5b:8b:ea:0e:0c:97:6b:20:ce:0a:0b:5d:19:f9:f3:ce:99:bb:24:6d:93:8b:4d:3c:e7:28:ac:44"
      },
      {
        "fptype": "sha256",
        "algo": "rsa",
        "hex": "ee:70:d2:6e:e3:a5:db:2c:45:e8:6b:43:01:3d:85:8c:83:2b:95:94:ba:93:23:c2:db:19:3b:d4:09:f4:cf:1a"
      },
      {
        "fptype": "sha256",
        "algo": "ecdsa",
        "hex": "fa:f3:d7:2b:51:69:7e:62:cd:1b:36:f9:d3:86:5b:dc:52:62:da:9f:3a:db:ef:5f:3b:a8:81:7b:2d:15:e8:00"
      }
    ],
    "duplicate_host_key_ips": [

    ],
    "compliance": {
      "policy": "Mozilla Modern",
      "compliant": false,
      "recommendations": [
        "Remove these key exchange algorithms: diffie-hellman-group16-sha512, diffie-hellman-group18-sha512, diffie-hellman-group14-sha256, diffie-hellman-group14-sha1",
        "Remove these MAC algorithms: umac-64-etm@openssh.com, hmac-sha1-etm@openssh.com, umac-64@openssh.com, hmac-sha1",
        "Remove these authentication methods: password"
      ],
      "references": [
        "https://wiki.mozilla.org/Security/Guidelines/OpenSSH"
      ],
      "grade": "D"
    },
    "start_time": "2023-02-22 15:33:47 +0000",
    "end_time": "2023-02-22 15:33:48 +0000",
    "scan_duration_seconds": 0.806951794
  }
]

And this is against an old Cisco 2811 router with IOS version 12.3(8r)T7:

weberjoh@vm32-test2:~$ ssh_scan -t router1.weberlab.de
[
  {
    "ssh_scan_version": "0.0.44",
    "ip": "2001:470:1f0a:319::2",
    "hostname": "router1.weberlab.de",
    "port": 22,
    "server_banner": "SSH-2.0-Cisco-1.25",
    "ssh_version": 2.0,
    "os": "cisco",
    "os_cpe": "o:cisco:cisco",
    "ssh_lib": "ciscossh",
    "ssh_lib_cpe": "a:cisco:ciscossh",
    "key_algorithms": [
      "diffie-hellman-group-exchange-sha1",
      "diffie-hellman-group14-sha1",
      "diffie-hellman-group1-sha1"
    ],
    "encryption_algorithms_client_to_server": [
      "aes128-cbc",
      "3des-cbc",
      "aes192-cbc",
      "aes256-cbc"
    ],
    "encryption_algorithms_server_to_client": [
      "aes128-cbc",
      "3des-cbc",
      "aes192-cbc",
      "aes256-cbc"
    ],
    "mac_algorithms_client_to_server": [
      "hmac-sha1",
      "hmac-sha1-96",
      "hmac-md5",
      "hmac-md5-96"
    ],
    "mac_algorithms_server_to_client": [
      "hmac-sha1",
      "hmac-sha1-96",
      "hmac-md5",
      "hmac-md5-96"
    ],
    "compression_algorithms_client_to_server": [
      "none"
    ],
    "compression_algorithms_server_to_client": [
      "none"
    ],
    "languages_client_to_server": [

    ],
    "languages_server_to_client": [

    ],
    "auth_methods": [

    ],
    "keys": {
    },
    "dns_keys": [
      {
        "fptype": "sha256",
        "algo": "rsa",
        "hex": "cc:88:fd:4a:a1:cb:8e:40:8f:13:01:ee:a5:16:1e:77:51:54:42:0a:d1:56:bf:39:0b:b3:13:6b:1e:2f:bf:cb"
      }
    ],
    "duplicate_host_key_ips": [

    ],
    "compliance": {
      "policy": "Mozilla Modern",
      "compliant": false,
      "recommendations": [
        "Add these key exchange algorithms: curve25519-sha256@libssh.org,ecdh-sha2-nistp521,ecdh-sha2-nistp384,ecdh-sha2-nistp256,diffie-hellman-group-exchange-sha256",
        "Add these MAC algorithms: hmac-sha2-512-etm@openssh.com,hmac-sha2-256-etm@openssh.com,umac-128-etm@openssh.com,hmac-sha2-512,hmac-sha2-256,umac-128@openssh.com",
        "Add these encryption ciphers: chacha20-poly1305@openssh.com,aes256-gcm@openssh.com,aes128-gcm@openssh.com,aes256-ctr,aes192-ctr,aes128-ctr",
        "Remove these key exchange algorithms: diffie-hellman-group-exchange-sha1, diffie-hellman-group14-sha1, diffie-hellman-group1-sha1",
        "Remove these MAC algorithms: hmac-sha1, hmac-sha1-96, hmac-md5, hmac-md5-96",
        "Remove these encryption ciphers: aes128-cbc, 3des-cbc, aes192-cbc, aes256-cbc"
      ],
      "references": [
        "https://wiki.mozilla.org/Security/Guidelines/OpenSSH"
      ],
      "grade": "F"
    },
    "start_time": "2023-02-22 15:42:52 +0000",
    "end_time": "2023-02-22 15:42:52 +0000",
    "scan_duration_seconds": 0.499461599,
    "error": "could not settle on encryption_client algorithm\nServer encryption_client preferences: aes128-cbc,3des-cbc,aes192-cbc,aes256-cbc\nClient encryption_client preferences: aes256-ctr,aes192-ctr,aes128-ctr"
  }
]

Note the recommendations and the grade.

Nmap Script ssh2-enum-algos

Another way is to use Nmap along with an NSE (Nmap Scripting Engine) script: ssh2-enum-algos. The call is simple as well: nmap --script ssh2-enum-algos <hostname|ip>. The output shows the algorithms only, as the name of the script suggests. As always with Nmap: If you want to scan via IPv6, you have to specify it with “-6” explicitly.

Again, this is a test run against the Ubuntu 18.04.6 LTS:

weberjoh@vm32-test2:~$ nmap --script ssh2-enum-algos test1.weberlab.de
Starting Nmap 7.93 ( https://nmap.org ) at 2023-02-23 09:36 UTC
Nmap scan report for test1.weberlab.de (194.247.5.25)
Host is up (0.00040s latency).
Not shown: 999 closed tcp ports (conn-refused)
PORT   STATE SERVICE
22/tcp open  ssh
| ssh2-enum-algos:
|   kex_algorithms: (10)
|       curve25519-sha256
|       curve25519-sha256@libssh.org
|       ecdh-sha2-nistp256
|       ecdh-sha2-nistp384
|       ecdh-sha2-nistp521
|       diffie-hellman-group-exchange-sha256
|       diffie-hellman-group16-sha512
|       diffie-hellman-group18-sha512
|       diffie-hellman-group14-sha256
|       diffie-hellman-group14-sha1
|   server_host_key_algorithms: (5)
|       ssh-rsa
|       rsa-sha2-512
|       rsa-sha2-256
|       ecdsa-sha2-nistp256
|       ssh-ed25519
|   encryption_algorithms: (6)
|       chacha20-poly1305@openssh.com
|       aes128-ctr
|       aes192-ctr
|       aes256-ctr
|       aes128-gcm@openssh.com
|       aes256-gcm@openssh.com
|   mac_algorithms: (10)
|       umac-64-etm@openssh.com
|       umac-128-etm@openssh.com
|       hmac-sha2-256-etm@openssh.com
|       hmac-sha2-512-etm@openssh.com
|       hmac-sha1-etm@openssh.com
|       umac-64@openssh.com
|       umac-128@openssh.com
|       hmac-sha2-256
|       hmac-sha2-512
|       hmac-sha1
|   compression_algorithms: (2)
|       none
|_      zlib@openssh.com

Nmap done: 1 IP address (1 host up) scanned in 0.62 seconds

And this is against the old Cisco 2811 router with IOS version 12.3(8r)T7:

weberjoh@vm32-test2:~$ nmap -6 --script ssh2-enum-algos router1.weberlab.de
Starting Nmap 7.93 ( https://nmap.org ) at 2023-02-23 09:38 UTC
Nmap scan report for router1.weberlab.de (2001:470:1f0a:319::2)
Host is up (0.028s latency).
Other addresses for router1.weberlab.de (not scanned): 37.24.166.89
rDNS record for 2001:470:1f0a:319::2: tunnel643592-pt.tunnel.tserv6.fra1.ipv6.he.net
Not shown: 997 closed tcp ports (conn-refused)
PORT     STATE SERVICE
22/tcp   open  ssh
| ssh2-enum-algos:
|   kex_algorithms: (3)
|       diffie-hellman-group-exchange-sha1
|       diffie-hellman-group14-sha1
|       diffie-hellman-group1-sha1
|   server_host_key_algorithms: (1)
|       ssh-rsa
|   encryption_algorithms: (4)
|       aes128-cbc
|       3des-cbc
|       aes192-cbc
|       aes256-cbc
|   mac_algorithms: (4)
|       hmac-sha1
|       hmac-sha1-96
|       hmac-md5
|       hmac-md5-96
|   compression_algorithms: (1)
|_      none
5060/tcp open  sip
8008/tcp open  http

Nmap done: 1 IP address (1 host up) scanned in 13.29 seconds

Conclusion

It’s just the very first step to merely look at your SSH servers. If you have to troubleshoot connection errors, you have to capture and analyse them in-depth. But if you want to know which protocols, keys, and so forth are possible, those SSH scanners do a great job.

If you want to improve your SSH server configuration, have a look at this guide.

Photo by Snowscat on Unsplash.

↧

Palo Alto: Instant Commit

$
0
0

Finally! With PAN-OS 11.0 Palo Alto Networks introduced an “instant commit”. That is: You no longer have to commit (and wait and wait and wait) until your changes are live, but everything you do is IMMEDIATELY active. Just as on any other firewall, e.g., the Fortis.

Here is how you can enable it along with some use cases and drawbacks:

Enabling this new feature is quite simple: It’s under Device -> Setup -> General Settings:

After that, you must make one more final commit until everything happens instantly.

To my mind, the biggest advantage of this is when testing new security policies and profiles. You no longer have to wait for the next commit until you see that it’s still not working. ;) Other changes that benefit from this are:

  • NAT stuff
  • routing protocol options to become neighbours
  • user identification agents
  • server profile settings such as RADIUS or syslog

However, there are situations where this is not advantageous though. That is: where the normal commit (that activates several changes at once) still has its charm:

  • setting a new IP address of the untrust interface along with its default route
  • changing IPsec tunnel parameters along with PSK and routes
  • changing routes along with exit interfaces and appropriate security zones in policies

Of course, you can always disable this option again for some time.

Note that PAN-OS 11.0 is not available on all current hardware platforms. Especially, it is not available on the PA-220. :( I tested it on a PA-820 cluster.

Happy configuring. ;)

Photo by eniko kis on Unsplash.

↧
↧

Stateful DHCPv6 Capture (along with Relaying)

$
0
0

For my IPv6 training classes, I was missing a capture of a stateful DHCPv6 address assignment. That is: M-flag within the RA, followed by DHCPv6 messages handing out an IPv6 address among others. Therefore, I set up a DHCPv6 server on an Infoblox grid and furthermore used a Palo Alto NGFW as a DHCPv6 relay to it. I captured on two points: from the client’s point of view (getting to the relay) and from the server’s point of view (unicast messages from the relay). And since I was already there anyway, I additionally captured the same process for DHCPv4. So, here we go:

Basic Setup

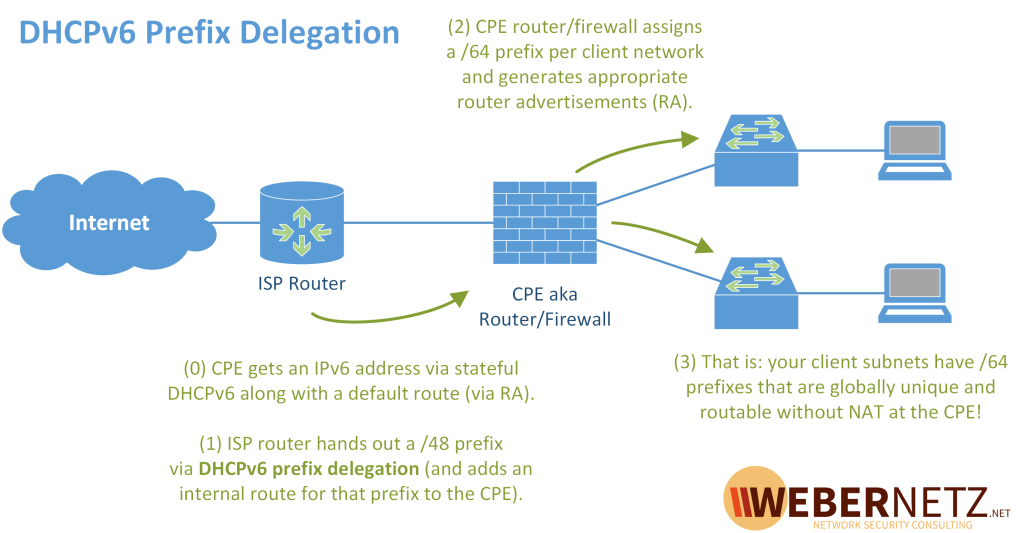
A picture is worth a thousand words:

Yep, it’s getting a little complicated with all these addresses. ;)

Capture Details

First, you can download these captures here. I did not join those two capture files on purpose, since it’s much easier to open them side by side this way.

However, it’s in the Ultimate PCAP as well, of course. :)

Note the differences within the IP addresses and UDP ports (both, IPv6 and legacy IP) with regard to the capturing points:
  1. At the client’s broadcast domain: multicast via link-local (fe80::
) / All_DHCP_Relay_Agents_and_Servers (ff02::1:2) for IPv6 while broadcast for IPv4
  2. At the server’s segment: unicast with GUAs for IPv6 and unicast for IPv4

On the client side, I captured with my ProfiShark. (VLAN 69 tagged since I captured right at the firewall but before the ESXi.) On the server side, I used the built-in “Traffic Capture” feature of the Infoblox Grid. Hence a “Linux cooked capture” encapsulation rather than a classical Ethernet frame. Simply ignore it. More details concerning legacy IP DHCPv4 sequences can be found here.

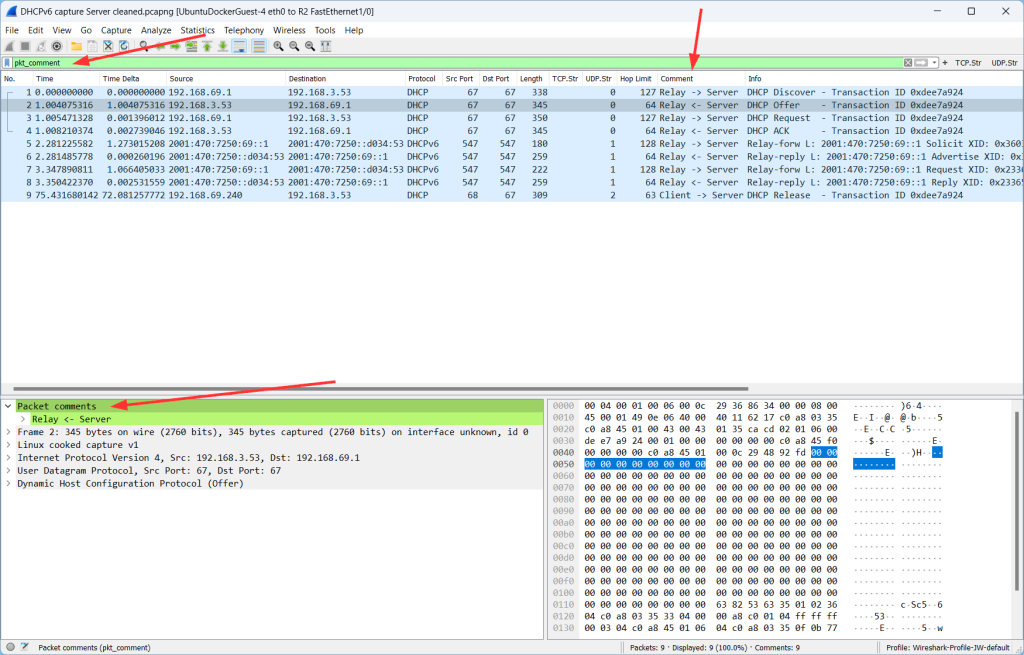
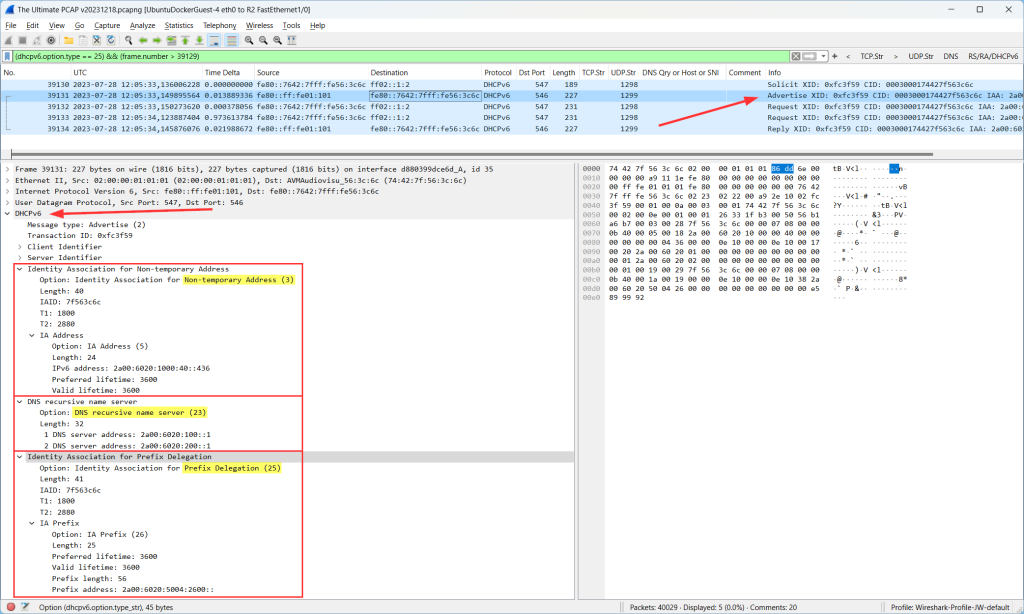
Here are some Wireshark screenshots. On the left-hand side the client’s perspective and on the right-hand side the server’s perspective. Please note the packet comments that I added to all those messages (and displayed them as a column as well). Likewise, note the differences in the Info column. First, IPv6:

Second, legacy IP:

One major difference between DHCP and DHCPv6: While the default gateway is sent for legacy IP within the DHCP messages, it is NOT sent for IPv6 via DHCPv6, since the IPv6 host already knows its default gateway via the router advertisement.

Another difference: While DHCP for legacy IP always embeds the client’s MAC address, DHCPv6 does not. It uses the concept of a “DHCP Unique Identifier (DUID)” which can be made out of different options.

My Ubuntu 20.04.5 LTS (GNU/Linux 5.4.0-144-generic x86_64) VM did release the IPv4 address upon shutdown, but not the IPv6 address. That’s why you can only see this single v4 release, sent by the client *directly* to the DHCP server, not via the relay. Hence this captured message is exactly the same in both capture files.

Detailed Setup

DHCPv6 Server on the Infoblox

Using NIOS version 9.0.0. DHCPv4 is as always. Let’s have a look at DHCPv6.

At first some Grid DHCP Properties. Note that the “Domain Name” is not working as expected with regards to DHCPv4 (at least with my Ubuntu clients). It is used for DDNS within the Infoblox DDI. To have a DNS search list on your client, you have to use the custom option 24 “dhcp6.domain-search”. While the SNTP servers option is working, I was *not* able to get the NTP option running. This would be option 56, which is not yet implemented in NIOS. (Why?!? Some discussion here.) Finally, note that you do NOT have a “default router” option with DHCPv6 at all, since the default router always propagates itself using router advertisements on the local link!

I added one IPv6 DHCP Range within a /64 network:

Don’t forget to activate IPv6 on the appropriate members. (So did I
 ;))

After some IPv6 addresses were handed out by the (stateful) DHCPv6 server, you can find them on the Active Leases page. Note the DUID for DHCPv6 rather than the mere MAC address for DHCPv4:

Relaying on the Palo

I’m using a PA-220 with PAN-OS 10.2.3 here in my lab. Quite simple: Network -> DHCP -> DHCP Relay -> adding the interface, activating the Internet Procols you want to use (in my case: both) and add the actual DHCP(v6) server addresses:

And don’t forget an appropriate policy allowing DHCP(v6) from this originating zone to the destination zone with the actual servers, such as:

Some, but not all (!) DHCP and DHCPv6 sessions are seen by the traffic log. The multicast (v6) respectively broadcast (v4) messages are not logged, but for v6 the unicast (relay) and link-local packets, while for v4 the unicast relay and the final release are:

That’s it. Happy troubleshooting. :D

Photo by Arno Senoner on Unsplash.

↧

Meinberg Syslog via TLS

$
0
0

More and more security-related devices are capable of sending syslog messages via an encrypted TLS channel. So does the well-known Meinberg LANTIME NTP server with its “LTOS” operating system. (And all the other LTOS-based NTP servers like the IMS or SyncFire series.) Here’s how you can configure it:

If you don’t have a TLS-capable syslog server: here’s my tutorial with syslog-ng. I’m using a LANTIME M200 with Firmware-Build 7.06.013 for the following tests. The syslog-ng server version 3.25.1-3 runs on a Ubuntu 20.04.6 LTS (GNU/Linux 5.4.0-148-generic x86_64).

Basic Configuration

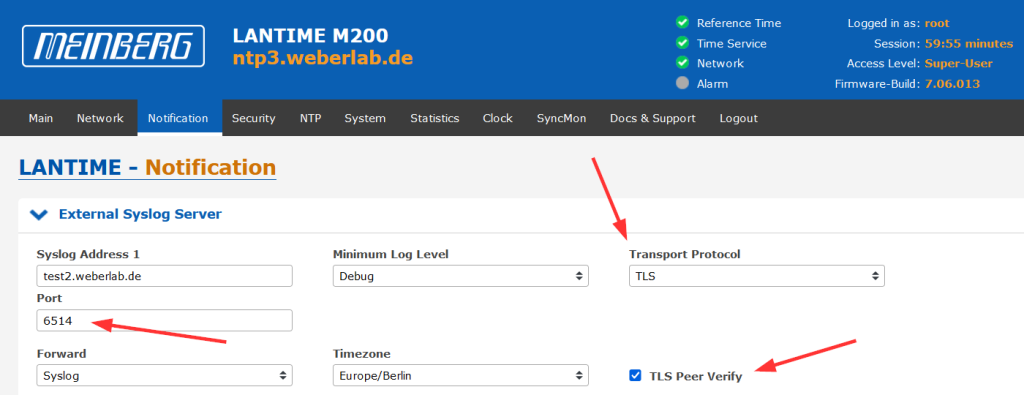
The configuration is quite simple: Head to Notification -> External Syslog Server and select the “Transport Protocol” as TLS rather than UDP or TCP. Please note that the port changes to the TLS default of 6514 and that the “TLS Peer Verify” is checked by default as well:

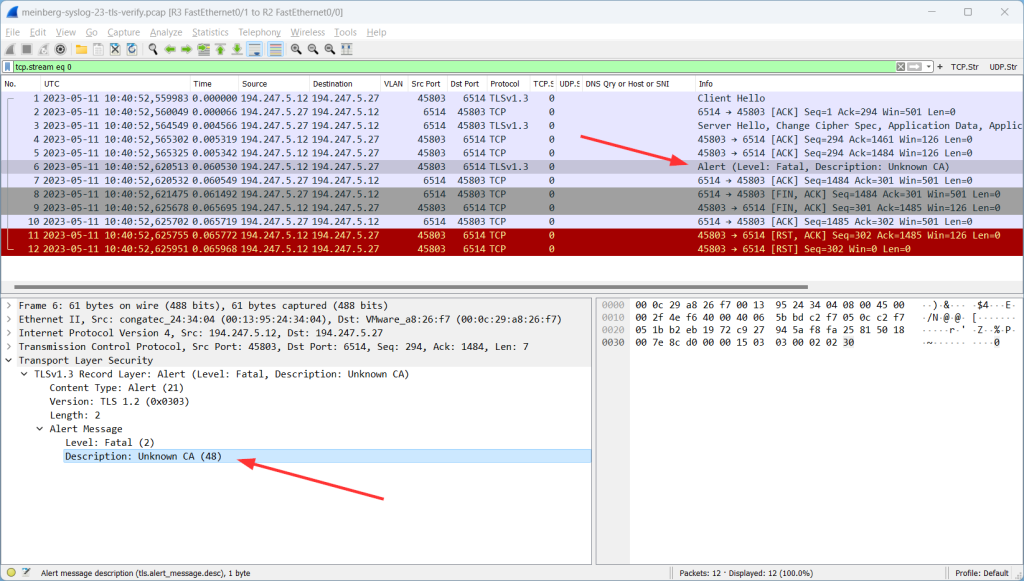
You will get into trouble if you don’t have imported the (root) certificate of your TLS-capable syslog server yet. ;) If so, nothing will be logged but you will see errors like this when capturing the traffic:

Please note that this is a good thing! This is how security should always work: with untrusted connections, no data should be transferred.

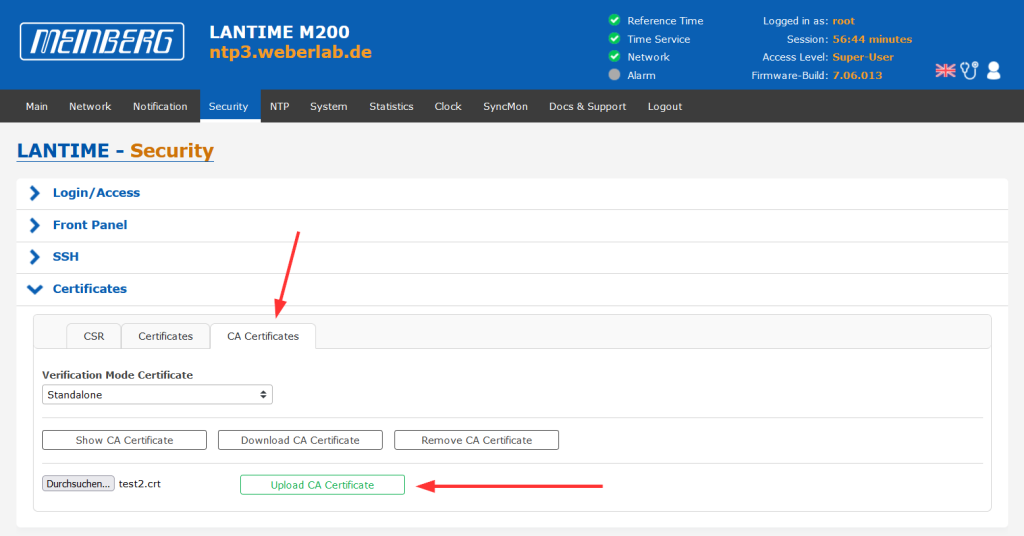
Hence, you should upload the root or self-signed certificate at Security -> Certificates -> CA Certificates like this:

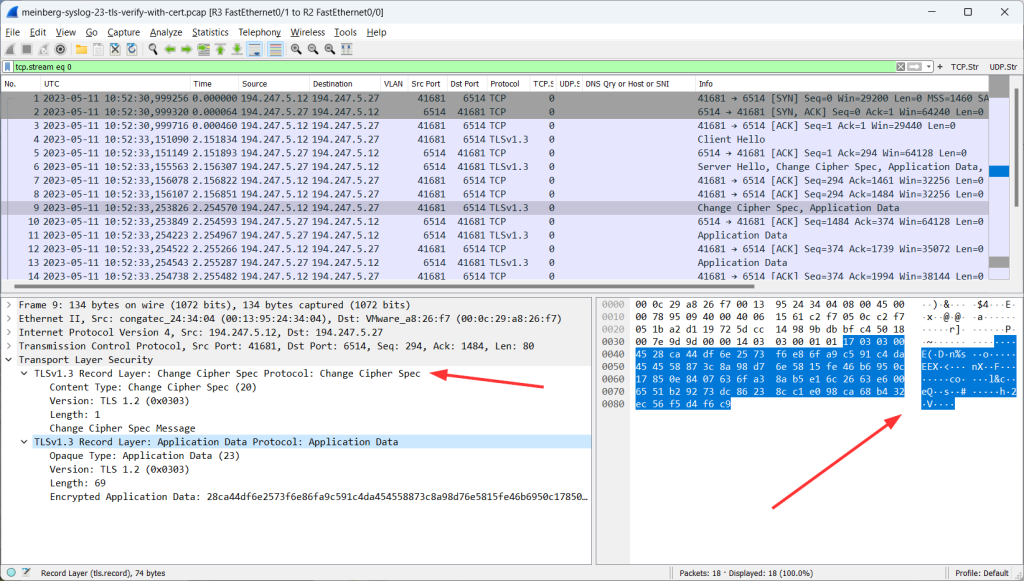
After that, you’ll see successful TLS connections, that is: change cipher spec, followed by randomly looking application data:

Some Notes

One thing I immediately noticed is, that syslog messages are sent over IPv4 though the configured hostname is dual-stacked with both, an A and AAAA record. This is in contrast to any modern OS, on which IPv6 is preferred over legacy IP. (Fun fact: This seems to be a syslog-ng thing because I recognized the same behaviour on a Palo Alto Networks firewall.) At least this is not security related.

Another little caveat I noticed is the following: There is no check whether the certificate’s name or any of the subject alternative names correlate to the hostname which is specified for the syslog server. E.g.: If the hostname is set to “foo.something.com” (which resolves to the actual IP address of the syslog server), while the uploaded certificate has its name and SAN set to “bar.something.com”. The “TLS peer verify” succeeds, though the certificate is not valid for this specified hostname. However, in my mind, this is not a big problem, since the crucial point is to validate the public key, rather than the name. Though I would have expected that the whole certificate, incl. the name, would be checked.

Luckily, Meinberg took care of those issues and dealt with them. Have a look at the next blog post. ;)

Further Reading

Photo by Max Harlynking on Unsplash.

↧

Meinberg LTOS: “syslog-ng” and the Observed Implementation Pitfalls

$
0
0

Meinberg, with the great help of Mr Weber, has implemented “syslog over TLS” in the LTOS version 7.06. The following report describes the general advantages of “syslog over TLS” and the implementation of it in the LTOS.

Why “Syslog over TLS” is a Good Idea

Syslog messages are a very effective means of monitoring the state of an IT system. Events reveal login attempts, error states, configuration changes, and a great deal of other security-critical information. There are also many who seek to have this data stored and analyzed centrally, for example, to provide “System Information and Event Management” systems (SIEM systems) with a common data source. Under ideal conditions, SIEM systems can process, collate, and build upon this information to provide system administrators with very useful reports that allow attacks on systems and networks to be detected early. However, it is important for syslog messages to be secured so that the transmission of syslog messages does not in its own right become a security issue, potentially allowing hackers to exploit the sensitive information in transit. Thankfully, the program “syslog-ng” used by the LANTIME Operating System (LTOS) supports a TLS connection. This TLS connection preserves, in particular, the integrity and confidentiality of the transmitted data. “syslog-ng” has been in use in LTOS for a long time for managing syslog messages, but the LTOS configuration possibilities always lacked the support of “syslog over TLS” in the past.

In theory, only two additional things are required to make use of the TLS functionality of “syslog-ng”. First, you need a valid root CA certificate, and second, the configuration parameter transport (“tls”) must be added to the “syslog-ng” configuration. In practice, as we’ll see below, it turns out to be not quite so simple, given that there are a couple of other things to consider. But let’s start by addressing in general terms how this functionality is implemented in LTOS.

Syslog over TLS in LTOS

Because “syslog-ng” is already installed and the Web Interface already offers the ability to configure external syslog servers, all that’s needed to complete the implementation is to set the new configuration parameters. These are “Transport Protocol = TLS”, the default “syslog over TLS” port 6514, and the switch “peer verify” to ensure that the server certificate’s validity is verified. Figure 1 shows the new configuration form provided from LTOS Version 7.06.001 onwards.

Figure 1: LTOS Web Interface: External Syslog Server

The function for uploading a root CA certificate was already in place before for LDAPS support and is located in the Web Interface under “Security -> Certificates -> CA Certificates”. It allows the certificates of the CAs (including optionally those of the intermediate CAs) that have signed the certificate of the syslog server. Public certificate authorities are already registered in the firmware, and an updated list is provided with each new version of the LTOS firmware.

This means that it is possible to implement the features broadly without any major adjustments or difficulties and that a connection can be established to a syslog server over TLS quickly.

As chance would have it, Mr Weber was already performing comprehensive tests in relation to “syslog over TLS” using products from other vendors at that time. Given this opportunity, we asked if he’d be willing to test a beta version of LTOS for Meinberg, which he said he’d be happy to do! So, many thanks once again for your support!

Implementation Pitfalls

Mr Weber’s test results with different IP protocols and Fully Qualified Domain Names did reveal a number of flaws, however.

Legacy IP is preferred over IPv6

As soon as an FQDN was entered as a server address, “syslog-ng” would use IPv4 rather than IPv6. If the DNS server returned an AAAA record for an IPv6 address and an A record for an IPv4 address, the IPv6 record would not be used. If only an IPv6 address was returned, the connection would not be established at all. A brief study of the “syslog-ng” documentation revealed that “syslog-ng” assumes a default value of IPv4 unless the desired protocol is explicitly declared, which is not really how name resolution is meant to work. Digging a little further revealed that this behaviour had already been recognized as a bug or a very valuable feature, depending on your point of view. The open issue at https://github.com/syslog-ng/syslog-ng/issues/3386 addresses the request to adjust this behaviour.

Therefore, in order to ensure that “syslog-ng” correctly implements name resolution, additional logic needs to be added. Based on a quick analysis of the code, patching “syslog-ng” itself would not have been a useful investment of time. The much simpler alternative was to draft a small script to perform the name resolution and to adapt the “syslog-ng” configuration to these specific circumstances. This enables a name resolution strategy to be formulated. The parameter “IP PROTOCOL” in /etc/mbg/ntf.cfg can be used to select one of the following options:

  • “4” (only IPv4 resolution)
  • “6” (only IPv6 resolution),
  • “4,6” (IPv4 resolution before IPv6 resolution)
  • “6,4” (IPv6 resolution before IPv4 resolution)

The following pseudocode describes the decision-making process. The function “check_if_valid_IPvX” tests if there is a syntactically valid IPv4 address. In addition to the process described by the pseudocode, the IP address can also be “pinged” to determine if it is reachable. The function “resolve_FQDN” triggers a DNS query based on the passed name and returns all recorded IP addresses.

# Pseudocode

#IP_CONF = [4],[6],[4,6] or [6,4]
#HOST = input of address field of external syslog servers
#Return values: ((The (FQDN or IP) and the IP-Protocol) or Error)

check_host(IP_CONF, HOST)
    for IPv in IP_CONF:
        if IPv == 4:
            if check_if_valid_IPv4(HOST):
                return HOST, 4
            else
                resIPs = resolve_FQDN(HOST)
                for resIP in resIPs:
                    if check_if_valid_IPv4(resIP):
                        return HOST, 4
        elif IPv == 6:
            if check_if_valid_IPv6(HOST):
                return HOST, 6
            else
                resIPs = resolve_FQDN(HOST)
                for resIP in resIPs:
                    if check_if_valid_IPv6(resIP):
                        return HOST, 6
    return "ERROR no valid IP or FQDN"

An example of a configuration line for an external syslog server with an FQDN reachable via IPv6 in /etc/syslog-ng/syslog-ng.conf would be:

destination syslog_server_1 { network( "syslog.test.example.fqdn" port(6514) ip-protocol(6) time-zone("Etc/GMT-5") transport("tls") tls( ca-file("/etc/ssl/certs/rootca_bundle.pem") peer-verify(yes) ) ); };

Check of Subject Alternative Names

Another problem found during testing was that, despite the “peer-verify” option being activated, the configured syslog server address did not need to match any of the “Subject Alternative Name” (SAN) entries in the certificate if you were using self-signed certificates. While browsers also do not check for a correct “Common Name” (CN) or SAN when a self-signed certificate is in play, the user still at least needs to provide explicit consent to grant such an exception for the certificate. “syslog-ng”, on the other hand, establishes the connection silently without any message output, despite the option “peer-verify(yes)” being explicitly declared. This would be a major security risk, albeit one that is thankfully not a problem with a two-tier PKI, which allows you to have a valid certificate issued by an official PKI to enable it to be recognized as valid by other domains.

Figure 2 shows examples of parameters that would normally be compared whenever the “TLS peer verify” option is enabled. The screenshot shows the “External Syslog Server” configuration form in the LTOS Web Interface at the top and the contents of an X.509 certificate below. The syslog server address entered here must match one of the SAN entries in the syslog server certificate. If there is no SAN entry, the deprecated CN field will be checked instead. A connection can only be established if the syslog server address matches one of the SANs or the CN precisely. Where wildcards are supported, the strings can vary within the scope afforded by the wildcards.

Figure 2: Sequence of the Server Address Checks

This means that in the case of self-signed certificates, because the server certificate is identical to the certificate on the client, the CN and SAN entries cease to have any real purpose – the ability to move the certificate with the key to a different server provides in its own right the means to get up to all kinds of no good.

For all those who use self-signed certificates despite the above, it’s worth noting that this behaviour deviates significantly from how it should operate according to the documentation (https://www.syslog-ng.com/technical-documents/doc/syslog-ng-open-source-edition/3.37/administration-guide/73\#TOPIC-1829193), whereby “peer-verify = yes” at the very least should compel “syslog-ng” not to trust a certificate if the client does not match a registered SAN or the CN.

Photo by Fabien Bazanegue on Unsplash.

↧
↧

Palo Alto NGFW: Handling of IPv6 on the Interface

$
0
0

For the last few years, I have been confused about Palo Alto NGFWs’ various options for configuring an IPv6 address on a layer 3 interface. Let’s have a look at some details:

I’m using a PA-220 with PAN-OS 10.2.4-h2.

My Defaults

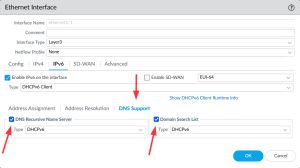
Normally, I’m enabling IPv6 on the interface (of course), leaving the Interface ID as “EUI-64”, adding a single GUI IPv6 address along with “Send RA” with its default values, while leaving the Duplicate Address Detection (DAD) unchecked (since it’s a firewall and you definitely want its address to be online) but enabling the NDP monitoring. I “Enable Router Advertisement” in general for this interface and include DNS information within the RAs. This looks like follows:

A show interface <interface name> shows the interface IPv6 addresses (link-local based on EUI-64 as well as the just configured global unicast) along with the advertised prefix:

weberjoh@pa> show interface ethernet1/8.21

--------------------------------------------------------------------------------
Name: ethernet1/8.21, ID: 257, 802.1q tag: 21
Operation mode: layer3
Virtual router default
Interface MTU 1500
Interface IP address: 192.168.21.1/24
Interface IPv6 address: fe80::286:9cff:fee7:5517/64
  2a00:6020:5004:2621::1/64
DAD: disabled
NDP Monitoring: enabled
IPv6 Client Mode: disabled
Router Advertisement: enabled
  Advertised IPv6 prefix:
    2a00:6020:5004:2621::1/64
DNS Support: enabled
  DNS Server(s):
    2a00:6020:5004:2600:1e69:7aff:fe0f:cc5e
  DNS Suffix(es):
    weberlab.de
[...]

Use interface ID as host portion

So far, so good. But I was confused about this “Use interface ID as host portion” option, which I enabled on another (sub)interface on the Palo for testing purposes:

For whatever reason, this option is named “Prefix” in the overview, which actually confused me even more:

In the end, this simply ignored the manually configured host portion of the IPv6 address and used the “Interface ID” option from the (sub)interface (which defaults to EUI-64) as the host portion. Hence the name. ;) The advertised prefix (line 16) still uses the manually configured IPv6 address rather than the one with the interface ID option:

weberjoh@pa> show interface ethernet1/8.22

--------------------------------------------------------------------------------
Name: ethernet1/8.22, ID: 259, 802.1q tag: 22
Operation mode: layer3
Virtual router default
Interface MTU 1500
Interface IP address: 192.168.22.1/24
Interface IPv6 address: fe80::286:9cff:fee7:5517/64
  2a00:6020:5004:2622:286:9cff:fee7:5517/64
DAD: disabled
NDP Monitoring: enabled
IPv6 Client Mode: disabled
Router Advertisement: enabled
  Advertised IPv6 prefix:
    2a00:6020:5004:2622::1/64
DNS Support: enabled
  DNS Server(s):
    2a00:6020:5004:2600:1e69:7aff:fe0f:cc5e
  DNS Suffix(es):
    weberlab.de

I have no clue why someone explicitly wants the host portion to be the EUI-64 one. Do you have any ideas, other than cosmetic? Maybe to have the same host portion for the link-local and the global unicast addresses? While the router advertisements are sent from the link-local address anyway. đŸ€·

Anycast?!?

To be honest, I don’t have any idea what this “Anycast” checkmark is all about at the IPv6 address configuration here. The doc states “Select to include routing through the nearest node.” Eh? Will this add this router address into some routing protocols as an additional host route? Any ideas someone?

Prefix Information

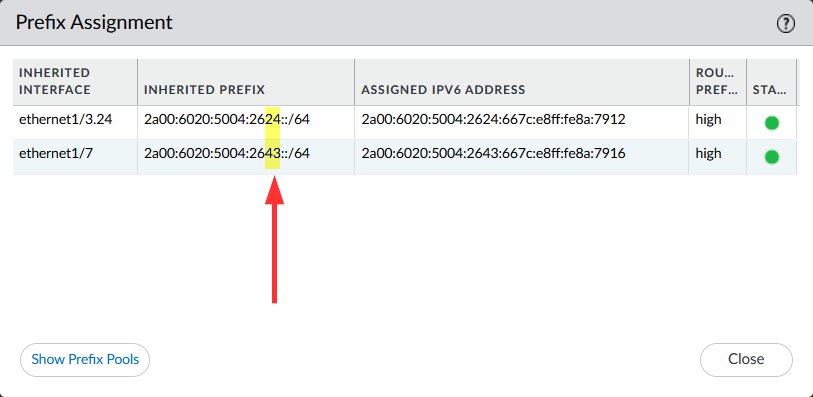
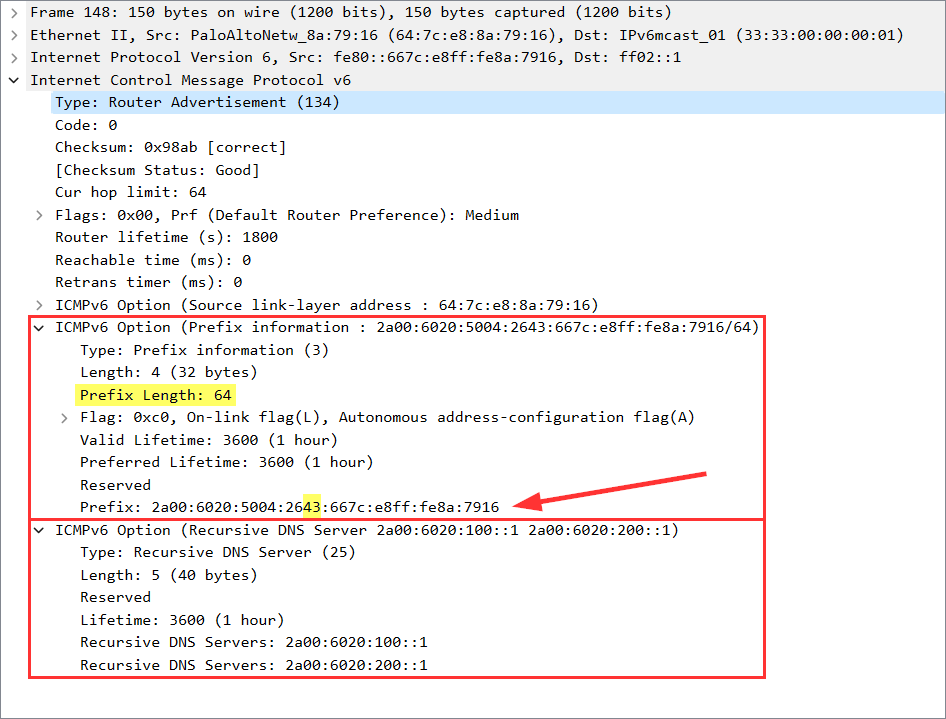
One more thing I noticed: The prefix information options within the ICMPv6 Router Advertisements are sent with the manually configured IPv6 address in both scenarios. That is: It is sent with the actual *address* of the router’s interface rather than the mere /64 prefix. While this is perfectly valid as of RFC 4861 (“An IP address or a prefix of an IP address.”), I personally prefer having the /64 prefix without a filled-in host portion in the RAs. Here are screenshots with the RAs from both interfaces I tested with. Wireshark decodes it as “Prefix”, which is not 100 % correct at this time (though unambiguous to my mind; no change required):

Photo by Thiago Palia on Unsplash.

↧

Verbindungsaufbau Deutsche Glasfaser

$
0
0

Als netzwerktechnisches Spielkind beschĂ€ftige ich mich nicht nur mit den Netzwerken großer Firmenumgebungen, sondern auch mit meinem eigenen Anschluss daheim. Vor vielen Jahren habe ich dem echten Dual-Stack Anschluss der Deutschen Telekom mal auf die Finger geguckt – heute ist die Variante der Deutschen Glasfaser an der Reihe, welches zwar ein Dual Stack, aber ohne eigene öffentliche IPv4 Adresse ist. Quasi ein halbes DS-Lite. Kernfrage fĂŒr mich war: Kann ich die Fritzbox (mit ihren mitgelieferten Presets fĂŒr verschiedene ISPs) durch eine echte Enterprise-Firewall ersetzen, die ja leider nicht unbedingt alle Sprecharten wie PPPoE im Subinterface oder PPP IPv6CP unterstĂŒtzen.

TL;DR: DHCP, DHCPv6-PD, RA.

Note that this post is one of many related to IPv6. Click here for a structured list.

Testaufbau

Bei einem Privatkundenanschluss der Deutschen Glasfaser (DG) habe ich einen echten TAP (in Form meines ProfiSharks) zwischen das Glasfaser-Modem und der Fritzbox gepackt und entsprechend alle Pakete originalgetreu mitgeschnitten:

Das Glasfaser-Modem (NT) ist von der DG gestellt und ein Nokia G-010G-Q GerĂ€t. Dort ist auch eine “Lower MAC ID” aufgedruckt, bei der ich aber nicht weiß, an welcher Stelle sie auftaucht. Es ist ja ein Modem auf Layer 1 und wandelt somit nur die Glasfaser auf ein Kupferkabel um. Ethernet (Layer 2) wird auf beiden Seiten gesprochen. (Oder? Zumindest gehe ich davon aus.) Als Router habe ich eine FRITZ!Box 7590 mit FRITZ!OS 7.56. Der Internetanbieter ist auf “Deutsche Glasfaser” gesetzt, die IPv6-Anbindung auf “Native IPv4-Anbindung verwenden”. (Hier könnte ich mal etwas mehr technische Details in der GUI gebrauchen, um zu verstehen, was genau diese Option im Gegensatz zu den anderen macht.)


Als TAP kam ein Profitap ProfiShark 1G zum Einsatz, welcher praktischerweise zwischen dem Modem und dem WAN-Port der Fritzbox eingeschleust werden konnte. Das Modem ging an Port A des TAPs, die Fritzbox an Port B. (Kann man in Wireshark bei Frame sehen, “on interface 
_A bzw. 
_B.) Modem und Fritzbox waren ausgeschalten. Ich hatte dann zuerst das Modem eingeschaltet und gewartet, bis sowohl “PON” als auch “LAN” grĂŒn leuchteten. Danach habe ich die Fritzbox eingeschaltet.

IP-technisch bietet die Deutsche Glasfaser IPv6 und IPv4 an. Leider aber kein richtiges IPv4. Sprich: Man hat *keine* echte öffentliche IPv4 Adresse mehr auf dem WAN-Interface des eigenen Routers, sondern eine weitere semi-private Adresse aus dem Bereich des Carrier-Grade NATs (CGNAT), nÀmlich 100.64.0.0/10. Ausgehender IPv4 Traffic wird doppelt ge-source-nattet: Am eigenen Router und erneut an einem CGNAT Router des ISPs. Eingehende IPv4 Verbindungen zum eigenen Router (DynDNS und Port Forwardings) sind somit passé. :(

ABER: DafĂŒr hat man *echtes* IPv6 Internet. Jeder Kund bekommt ein /56er PrĂ€fix, welches meiner Erfahrung nach sogar statisch ist. Es ĂŒberlebt einen Reboot des Routers. Das ist unglaublich gut. Zum GlĂŒck macht die DG hier nicht den Quatsch eines dynamischen IPv6 PrĂ€fixes mit, wie es leider andere ISPs in Deutschland wie die Telekom machen.

Ich dachte immer, dass man diese Anschlussart bereits als DS-Lite bezeichnet. Technisch korrekt ist ein CGNAT aber nur die eine HĂ€lfte von DS-Lite. Die andere wĂ€re das Tunneln von IPv4 ĂŒber eine IPv6-only Infrastruktur im Backbone des ISPs. Dies ist bei der DG nicht der Fall, was immerhin die typischen Probleme von DS-Lite AnschlĂŒssen wie die verringerte MTU-Size umgeht. (Danke an Thomas fĂŒr den Hinweis!)

Analyse

ZunÀchst mal kamen noch vor der IP-Adressvergabe bereits IPv6 und IPv4 PÀckchen vom Modem an. Das waren aber alles vorherige Sessions von vor dem Ausschalten, oder eingehende Verbindungen zu meinen gehosteten Servern Raspis. Deutet auf jeden Fall darauf hin, dass dem Glasfaser-Anschluss ein dedizierter Port am vorgelagerten Switch/Router zugewiesen ist bzw. der ARP-/Neighbour-Cache noch am Leben war.

Legacy IP

Die öffentliche CGNAT IPv4 Adresse bekommt der eigene Router ganz klassisch per einfachem DHCPv4. Kein PPP oder PPPoE oder sonstwas und auch keine Authentifizierung. Einfach nur DHCP. Wie angenehm. Hier zwei Screenshots, welche das Discover der Fritzbox und das Offer der DG zeigen. ARP fand erst nach der DHCP Session statt. Und anscheinend ist der ARP Timeout der Fritzbox 300 Sekunden, weil immer dann (Delta Time) ein neuer ARP Request kam:

IPv6

ZunĂ€chst sendet die Fritzbox ihre Duplicate Address Detection (DAD, Punkt 1 im Screenshot) fĂŒr ihre link-local Adresse, gefolgt von ein paar Router Solicitations (RS, 2). Diese RSs werden an dieser Stelle aber nicht durch ein entsprechendes Router Advertisement (RA) beantwortet! Das ist schon mal die erste interessante Erkenntnis. FĂŒr das DHCPv6 wartet die Fritzbox aber zum GlĂŒck nicht auf das M-Flag im RA, sondern fĂ€ngt kurzerhand selbst mit einem SOLICIT (3) an. Der DUID Type der Fritzbox ist vom Typ “link-layer address” (Pfeil 4) und anfragen tut sie neben einer non-temporary address (5) auch einen Prefix ohne LĂ€ngenangabe (6, DHCPv6-PD, Prefix Delegation):

Im DHCPv6 ADVERTISE sehen wir den Server Identifier der Deutschen Glasfaser vom Typ “link-layer address plus time” und eine MAC-Adresse, die von der OUI auf “VMware, Inc.” hinweist (1). (Fun fact: Die MAC-Adresse an dieser Stelle wird von Wireshark trotz der eingeschalteten “Resolve Physical Addresses” Option nicht aufgelöst. Einen Feature Request habe ich entsprechend gestellt, der keine 2 Tage spĂ€ter bereits implementiert war!) Dann die non-temporary address fĂŒr das WAN-Interface das Fritzbox selbst (2), die IPv6 Adressen der rekursiven DNS Server (3), und schließlich der ersehnte PrĂ€fix mit einer /56 LĂ€nge (4). DANKE noch mal an dieser Stelle an die Deutsche Glasfaser, dass sie sich an sinnvolle Vorgaben hĂ€lt und nicht etwa ein /60, /62 oder gar ein einziges /64 liefert. NĂ€chste Erkenntnis: Die Fritzbox macht keine Duplicate Address Detection fĂŒr die soeben erhaltene global unicast Adresse, obgleich der Standard (RFC 4862) das explizit vorschreibt. (Mehr bzgl. DAD hier.)

Interessant ist weiterhin, dass zu diesem Zeitpunkt noch nicht die Default Route bekannt ist. Denn:

Anders als bei DHCP fĂŒr IPv4, bei dem die IPv4 Adresse des Default Routers im DHCP mitgeschickt wird, ist bei IPv6 ausschließlich das Router Advertisement (und eben nicht DHCPv6) fĂŒr die Bekanntgabe des Default Routers zustĂ€ndig.

Eben dieses notwendige RA (1) kam aber erst mit einer Verzögerung von knapp 600 Sekunden (2) = 10 Minuten (!!!) bei der Fritzbox an. Es deutet also darauf hin, dass die RAs seitens der Deutschen Glasfaser hier ausschließlich periodisch, nicht jedoch in Anfrage eines RS, verschickt werden. Die link-local Adresse des DG Routers sieht auch lustig aus: fe80::ff:fe:01:101 (3). Das M-flag ist korrekt gesetzt (4) und unmittelbar danach fragt die Fritzbox per Neighbour Solicitation auch nach der MAC-Adresse eben dieses Routers (5). Dieses NS wiederholt sich dann alle knapp 30 Sekunden. Ob der Neighbour Cache Timeout der Fritzbox auf nur 30 Sekunden steht?

Genau dieses Fehlen der Default Route sorgt leider fĂŒr ein verzögertes IPv6. In der Tat hat ein Ping ĂŒber IPv4 wenige Augenblicke nach Einschalten der Fritzbox wieder funktioniert, wĂ€hrend IPv6 erst einige Minuten spĂ€ter lief. Entsprechend hatte bis dahin die Fritzbox korrekterweise mit einem “No route” von ihrer WAN-Interface GUA Adresse geantwortet:

From 2a00:6020:1000:40::436 icmp_seq=312 Destination unreachable: No route
From 2a00:6020:1000:40::436 icmp_seq=313 Destination unreachable: No route
From 2a00:6020:1000:40::436 icmp_seq=314 Destination unreachable: No route
From 2a00:6020:1000:40::436 icmp_seq=315 Destination unreachable: No route
From 2a00:6020:1000:40::436 icmp_seq=316 Destination unreachable: No route
From 2a00:6020:1000:40::436 icmp_seq=317 Destination unreachable: No route
From 2a00:6020:1000:40::436 icmp_seq=318 Destination unreachable: No route
From 2a00:6020:1000:40::436 icmp_seq=319 Destination unreachable: No route
64 bytes from redirector.heise.de (2a02:2e0:3fe:1001:302::): icmp_seq=320 ttl=57 time=6.98 ms
64 bytes from redirector.heise.de (2a02:2e0:3fe:1001:302::): icmp_seq=321 ttl=57 time=4.65 ms
64 bytes from redirector.heise.de (2a02:2e0:3fe:1001:302::): icmp_seq=322 ttl=57 time=2.73 ms
64 bytes from redirector.heise.de (2a02:2e0:3fe:1001:302::): icmp_seq=323 ttl=57 time=4.20 ms
64 bytes from redirector.heise.de (2a02:2e0:3fe:1001:302::): icmp_seq=324 ttl=57 time=2.92 ms
64 bytes from redirector.heise.de (2a02:2e0:3fe:1001:302::): icmp_seq=325 ttl=57 time=4.94 ms
64 bytes from redirector.heise.de (2a02:2e0:3fe:1001:302::): icmp_seq=326 ttl=57 time=3.94 ms
64 bytes from redirector.heise.de (2a02:2e0:3fe:1001:302::): icmp_seq=327 ttl=57 time=5.84 ms

Nunja, es gibt schlimmeres. Aber ganz sauber ist es halt auch noch nicht. Und es sorgt natĂŒrlich nicht fĂŒr ein “IPv6 ist genau so gut umgesetzt wie IPv4” bei den Endnutzern. :( Ich werde sowohl die Deutsche Glasfaser als auch AVM mal anschreiben/-twittern.

(Die oben gezeigten Pakete werden ihren Weg auch ins Ultimate PCAP finden.)

Fritzbox durch Firewall ersetzen

Bei meinem damaligen Versuch, an einen Glasfaseranschluss der Telekom eine Enterprise-Firewall ans Rennen zu bekommen, bin ich ziemlich gescheitert. Zu viele Untervarianten der PPP Protokolle konnten die Firewalls damals nicht richtig umsetzen. Hier sollte das jetzt anders aussehen. DHCP fĂŒr IPv4 ist absoluter Standard, und auch DHCPv6 und DHCPv6-PD beherrschen die gĂ€ngigen Betriebssysteme von Palo Alto Networks oder Fortinet. Ich bin gespannt. Und es bleibt noch offen, ob VoIP aka SIP mit der Deutschen Glasfaser funktioniert, wenn der SIP-Endpunkt nicht das direkt angeschlossene GerĂ€t ist. Das ließ sich vor Jahren mit einer Juniper ScreenOS Firewall ebenso schlecht aufbauen.

Photo by Andrik Langfield on Unsplash.

↧

Minor Palo Bug: ICMPv6 Errors sourced from Unspecified Address

$
0
0

During my IPv6 classes, I discovered a (minor) bug at the NGFW from Palo Alto Networks: ICMPv6 error messages, such as “time exceeded” (type 3) as a reply of traceroute, or “destination unreachable” (type 1) as a reply of a drop policy, are not correctly sourced from the IPv6 address of the data interface itself, but from the unspecified address “::”. Here are some details:

Tested environments: PA-220 with PAN-OS 10.2.4-h2 and 10.2.5, as well as PA-440 with PAN-OS 11.0.2-h2.

The Bug

I basically stumbled upon this problem as I played around with some traceroutes:

weberjoh@nb15-lx:~$ traceroute -6 lx2.weberlab.de
traceroute to lx2.weberlab.de (2001:470:1f0b:16b0::a36:22), 30 hops max, 80 byte packets
 1  :: (::)  1.095 ms  0.763 ms  0.755 ms
 2  * * *
 3  * * *
 4  * * *
 5  port-channel12.core2.fra1.he.net (2001:470:0:63d::1)  3.155 ms  3.590 ms *
 6  tserv1.fra1.he.net (2001:470:0:69::2)  46.521 ms  49.557 ms  52.595 ms
 7  tunnel525322-pt.tunnel.tserv6.fra1.ipv6.he.net (2001:470:1f0a:16b0::2)  124.070 ms  122.339 ms  121.901 ms
 8  2001:470:1f0b:16b0::a36:22 (2001:470:1f0b:16b0::a36:22)  80.968 ms  77.495 ms  74.469 ms

In Wireshark, this looks as follows:

Later on, I discovered the same behaviour when a security policy’s action is set to “Drop” along with “Send ICMP Unreachable”, e.g. here:

This looks as follows in Wireshark (different ICMPv6 type, but the same wrong address):

The source address of “::” as sent from the Palo is incorrect.

RFC 4443 “Internet Control Message Protocol (ICMPv6) for the Internet Protocol Version 6 (IPv6) Specification” defines how the source address of an originating ICMPv6 packet MUST look like:

[
] the Source Address of the ICMPv6 packet MUST be a unicast address belonging to the node.

The very only case, in which an IPv6 packet is sent from the unspecified address, is the Duplicate Address Detection process and its corresponding Neighbour Solicitation. (RFC 4861 and RFC 4291.)

Two more notes:

  1. This only happens with IPv6. For legacy IP, the correct data interface IPv4 address is chosen as the source address.
  2. This only appears on VLAN interfaces, but not on “normal” Layer 3 interfaces. <- This is interesting because some years ago I found another IPv6 bug which was related to a VLAN interface as well. To me, this seems like the IPv6 routines for different types of interfaces on PAN-OS are not exactly the same.

On a mere Layer 3 interfaces those ICMPv6 packets are sourced correctly:

PAN Ticket -> Bug

In October 2022, I created a ticket at the PAN support, telling them about this bug. Luckily, I was able to convince the ticket owner that this has to be fixed since it is clearly a violation of the Internet standards. (To be fair, I also told them that I don’t believe that this is a big thing nor security-related.) The bug got the bug ID PAN-214336. After some months, I got an update from the engineering team, saying that this should be fixed with PAN-OS 10.2.5. Unfortunately, this wasn’t the case. Neither is this bug listed in the release notes nor is it actually fixed with PAN-OS 10.2.5, as I tested it again. Furthermore, it is present in the PAN-OS 11.x major versions as well.

Hopefully, it will get fixed someday. At least, you guys can google it now. :)

Soli Deo Gloria.

Photo by Valeriy Borzov on Unsplash.

↧

Basic NTP Client Test on Windows: w32tm

$
0
0

When implementing NTP servers, it’s always an interesting part to check whether the server is “up and running” and reachable from the clients. While I’ve done many basic NTP checks out of Linux, I lacked a small docu to do this with Windows. It turned out that there’s no need for third-party software because Windows already includes a tool to test NTP connections: w32tm.

This article is one of many blogposts within this NTP series. Please have a look!

So there is this tool called W32Time with many options to not just test NTP servers, but to configure Windows’ time service and so on. In our simple test case, we just want to query a server with these two options:

w32tm /stripchart /computer:HOSTNAME-OR-IP

This displays a chart showing the offset of your local computer’s time (displayed as a | ) to the time delivered through NTP (shown as a * ). Missing replies are marked with a failure:

C:\Users\jweber2>w32tm /stripchart /computer:ntp3.weberlab.de
ntp3.weberlab.de wird verfolgt [[2001:470:1f0b:16b0::dcfb:123]:123].
Es ist 29.09.2023 09:31:07.
09:31:07, d:+00.1196315s o:+01.2824897s  [                           |   *                       ]
09:31:09, d:+00.0666032s o:+01.2738181s  [                           |  *                        ]
09:31:11, d:+00.1376563s o:+01.1849168s  [                           |  *                        ]
09:31:13, d:+00.1089684s o:+01.2882442s  [                           |   *                       ]
09:31:16, d:+00.0238122s o:+01.2431296s  [                           |  *                        ]
09:31:18, d:+00.2107968s o:+01.2974940s  [                           |   *                       ]
09:31:20, d:+00.0223062s o:+01.2419022s  [                           |  *                        ]
09:31:22, d:+00.1731343s o:+01.2643331s  [                           |  *                        ]
09:31:24, d:+00.0819059s o:+01.2757827s  [                           |   *                       ]
09:31:26, d:+00.0359837s o:+01.2362617s  [                           |  *                        ]
09:31:28, d:+00.1817614s o:+01.2444196s  [                           |  *                        ]
09:31:30, Fehler: 0x800705B4
09:31:34, d:+00.0135745s o:+01.2475575s  [                           |  *                        ]
09:31:36, d:+00.0184675s o:+01.2438881s  [                           |  *                        ]
^C

When the offset is really low, only the asterisk is seen:

C:\Users\jweber2>w32tm /stripchart /computer:ntp3.weberlab.de
ntp3.weberlab.de wird verfolgt [[2001:470:1f0b:16b0::dcfb:123]:123].
Es ist 29.09.2023 11:26:47.
11:26:47, d:+00.1652050s o:+00.0843570s  [                           *                           ]
11:26:49, d:+00.1185437s o:+00.0199126s  [                           *                           ]
11:26:52, d:+00.1057113s o:+00.0478628s  [                           *                           ]
11:26:54, d:+00.0935680s o:+00.0391876s  [                           *                           ]
11:26:56, d:+00.1525955s o:+00.0712276s  [                           *                           ]

Interestingly, when looking at the packets with Wireshark, you can see that the NTP version number is set to 1, while normally clients/servers are using version 4: (Packet 523 did not get an answer for whatever reason and was marked by w32tm accordingly.)

One more tool tip though: With w32tm /query /status you can verify which time source your computer is synced to. In my case, this was a local CMOS clock rather than an NTP server. That’s why the offset (in the first chart above) was about 1 second rather than smaller ones in the range of ms.

C:\Users\jweber2>w32tm /query /status
Sprungindikator: 3(nicht synchronisiert)
Stratum: 0 (nicht angegeben)
PrÀzision: -23 (119.209ns pro Tick)
Stammverzögerung: 0.0000000s
Stammabweichung: 0.0000000s
Referenz-ID: 0x00000000 (nicht angegeben)
Letzte erfolgr. Synchronisierungszeit: nicht angegeben
Quelle: Local CMOS Clock
Abrufintervall: 10 (1024s)

Please note that I’m neither testing the classical NTP authentication nor NTS at this point. It’s only about the reachability of the NTP server.

Soli Deo Gloria.

Photo by Brad Neathery on Unsplash.


↧
↧

Contributing to Wireshark (without any coding skills!)

$
0
0

For many years I was afraid to open new issues for open-source tools since I am not a coder at all and won’t ever be able to fix some of the problems. Many times I got answers like “The source is open, go ahead and fix it yourself”. This brought me to a point where I simply stopped proposing new ideas and features.

This has changed since I was at SharkFest’22 EUROPE (the Wireshark Developer and User Conference), especially at a session from Uli Heilmeier called “Contribute to Wireshark – the low hanging fruits” [PDF].

TL;DR: You don’t need to be a programmer to contribute to Wireshark! E.g., submit new feature requests, report bugs or write at the wiki.

And that is exactly what I would like to recommend to you. This post is about giving examples, that even minor errors and thoughts are appreciated by the Wireshark team. But, of course, if you actually have coding skills, please go ahead and fix some of the issues. ;)

Here are some feature requests I opened during the last year which actually got resolved. Most of them with Wireshark version 4.2.0 (November 15, 2023).

Kudos to the Wireshark developers who almost instantly answered and added the feature requests: Uli Heilmeier, John Tacker, Alexis La Goutte, Martin Mayer, Guy Harris, Chuck Craft, Jim Young.

Default Coloring Rule “TTL low or unexpected” not optimal

I had some issues with the default colouring rule for “TTL low
”. At first, it was only used for legacy IP (with its ip.ttl field) and not for IPv6 (with its equivalent ipv6.hlim field). Furthermore, some routing protocols such as EIGRP or GLBP were coloured in red though they were working correctly. We had a little discussion about that and changed the legacy IP TTL rule to:

IPv4 TTL low or unexpected: (ip.dst != 224.0.0.0/4 && ip.ttl < 5 && !(pim || ospf || eigrp || bgp || tcp.port==179)) || (ip.dst == 224.0.0.0/24 && ip.dst != 224.0.0.251 && ip.ttl != 1 && !(vrrp || carp || eigrp || rip || glbp))

while we added an IPv6 rule (with correct naming):

IPv6 hop limit low or unexpected: (ipv6.dst != ff00::/8 && ipv6.hlim < 5 && !( ospf|| bgp || tcp.port==179)) || (ipv6.dst==ff00::/8 && ipv6.hlim not in {1, 64, 255})

The first screenshot shows the colouring rules pre-4.2.0 and the second screenshot the most current ones. Have a look at the new “IPv6 hop limit 
” rule:

Note that your traceroutes (especially for IPv6) will look differently now, since the first packets, where the hop limit is set to low values intentionally, are now marked red. Furthermore, all Wireshark screenshots from the past years, where the old rules kicked in, are outdated now. 😂

“Discard” Protocol (TCP/UDP port 9) not yet there

While adding some more protocols to the Ultimate PCAP, I came along with this fairly old network protocol called “Discard”, RFC 863, which was not recognized by Wireshark yet. Less than 24 hours later, it was done. Wow.

Display Filter dns.qry.type with types rather than values

This one is much more relevant. You can now use the Display Filter for filtering DNS queries based on their type, such as “aaaa”, “txt”, “ptr”, and so on. Here’s an example of filtering out any DNS packets belonging to DNSSEC’s “dnskey”:

Source port column shows odd values

A classical bug – a really small one. ;) For whatever reason some GUI fields showed wrong values for source ports. Though I mentioned it and it got fixed, of course. Screenshot before the fix:

ICMPv6 RA flag: Proxy?!?

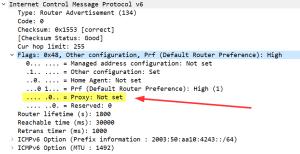
“What’s that Proxy bit in an RA?” I got this question during one of my IPv6 trainings. Uh, I don’t know to be honest. ;) I’m not aware of any proxy at this stage. Turned out it was just an experimental RFC talking about Neighbour Discovery Proxies (ND Proxy). The solution was to rename it to “ND Proxy” and to add that experimental RFC in the info line at the bottom of Wireshark. Screenshots before and after the fix:

Resolve Phyiscal Addresses within DHCP and DHCPv6 “Client Identifier”

Can’t Wireshark resolve the physical addresses (MAC addresses) within DHCPv6/DHCP packets? Yes, it can. Screenshots before and after 4.2.0:

Dissector needed: WS-Discovery, UDP port 3702

Something weird again: What’s that UDP-based discovery protocol my Windows 11 sends out? And why isn’t there any information about it in Wireshark? A little googling brought me to Wikipedia: WS-Discovery. Since we don’t have any XML schema for this WS-Discovery thing currently, it is a least dissected as XML in the meantime:

[not yet solved] Connecting line for ICMP errors not working in both directions

One problem remains, since this seems to be a harder one, or at least requires more work: Wireshark draws a connecting line between a packet and its corresponding ICMP error (if any). However, this process does not work in the opposite direction, that is: If you click the ICMP error, there’s no line back to the originating packet.

Is anyone accepting a challenge? 😂

Soli Deo Gloria.

Photo by Austin Kehmeier on Unsplash.

↧

More Capture Details III

$
0
0

Another update of the Ultimate PCAP is available. Again, there are some special new packets in there which I want to point out here. Feel free to download the newest version to examine those new protocols and packets by yourself. Featuring: SNMPv3, WoL, IPMI, HSRP, Zabbix, Pile of Poo, and Packet Comments. ✅

SNMPv3 with AuthPriv

We all know that SNMPv2c (the “security not my problem” protocol) is heavily insecure, hence we should use SNMPv3 with AuthPriv to get authentication and privacy. Here are some packets to look at. A checkmk instance queries a Meinberg LANTIME M200 NTP server. IPv6 and legacy IP:

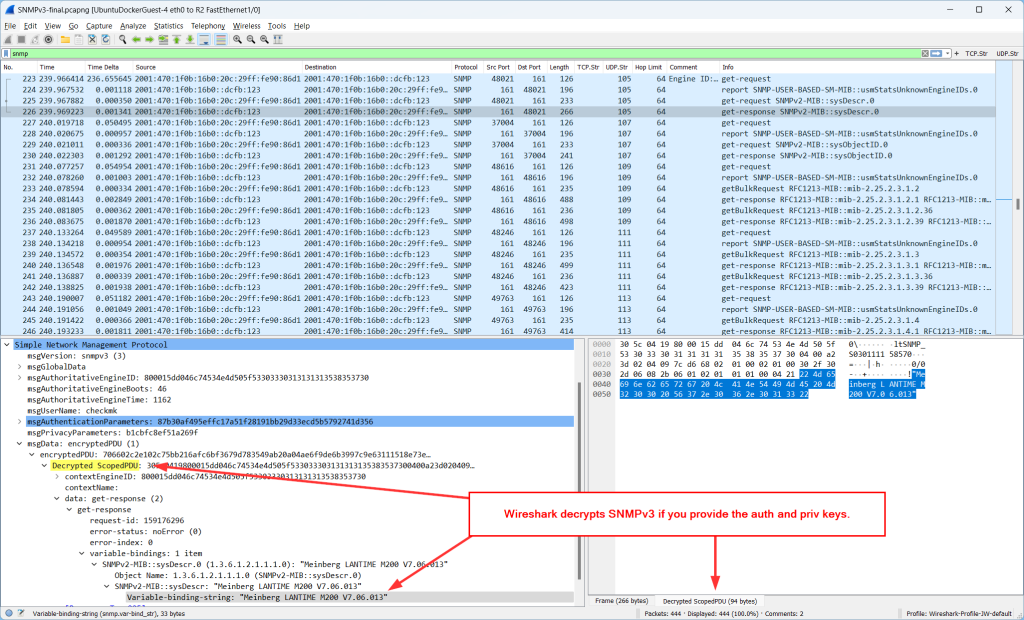
Now, here is the neat thing about Wireshark: You can add the auth and priv keys to get those packets decrypted. Here they are for those packets:

  • Username: checkmk
  • SHA256: rWezwNZIbgLN6Fka4iZ8
  • AES128: jwmY294SQXt4AD9kPGKD

I also added that information in the packet comments of the very first SNMPv3 packet for IPv6 and legacy IP. This is how you can add them: Edit -> Preferences -> Protocols -> SNMP -> Users Table -> Edit -> Create new entry:

After that, Wireshark shows “Decrypted ScopedPDU” data in readable text within the Packet Details pane as well as at the Packet Bytes pane:

Wake-on-LAN, WoL

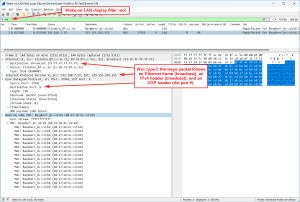
Waking up a Raspi via Wake-on-LAN packets. There are two variants to send the magic packet, which is sixteen repetitions of the target computer’s 48-bit MAC address:

  1. directly following the Ethernet frame, Ethertype 0x0842 (though not officially registered), using this tool: sudo etherwake -i eno1 B8:27:EB:BC:CD:B4
  2. encapsulated in an IP and UDP packet/datagram (UDP destination port 9, the “Discard” protocol), sent to the Ethernet and IP broadcast address, using: wakeonlan B8:27:EB:BC:CD:B4

Both variants are display filtered with simply wol:

Some more details about WoL are on the Wireshark Wiki.

IPMI/RMCP+

“The Intelligent Platform Management Interface (IPMI) is a set of computer interface specifications for an autonomous computer subsystem that provides management and monitoring capabilities independently of the host system’s CPU, firmware (BIOS or UEFI) and operating system”, Wikipedia. Don’t ask me any details about it, please. :D You can monitor and power on/off servers and so on. In my case, I’m using the ipmitool (version 1.8.18) to query an HP ProLiant DL380p Gen8 server (iLO firmware 2.78) like this:

weberjoh@nuc:~$ ipmitool -I lanplus -H esxi3-ilo.weberlab.de -U Testuser -P ThisIsThePassword sensor
UID Light        | 0x0        | discrete   | 0x0180| na        | na        | na        | na        | na        | na
Sys. Health LED  | na         | discrete   | na    | na        | na        | na        | na        | na        | na
01-Inlet Ambient | 24.000     | degrees C  | ok    | na        | na        | na        | na        | 42.000    | 46.000
02-CPU 1         | 40.000     | degrees C  | ok    | na        | na        | na        | na        | 70.000    | na
03-CPU 2         | 59.000     | degrees C  | ok    | na        | na        | na        | na        | 70.000    | na
04-P1 DIMM 1-3   | 36.000     | degrees C  | ok    | na        | na        | na        | na        | 87.000    | na
05-P1 DIMM 4-6   | na         |            | na    | na        | na        | na        | na        | 87.000    | na
06-P1 DIMM 7-9   | 36.000     | degrees C  | ok    | na        | na        | na        | na        | 87.000    | na
07-P1 DIMM 10-12 | 37.000     | degrees C  | ok    | na        | na        | na        | na        | 87.000    | na
08-P2 DIMM 1-3   | 42.000     | degrees C  | ok    | na        | na        | na        | na        | 87.000    | na
09-P2 DIMM 4-6   | na         |            | na    | na        | na        | na        | na        | 87.000    | na
10-P2 DIMM 7-9   | 36.000     | degrees C  | ok    | na        | na        | na        | na        | 87.000    | na
11-P2 DIMM 10-12 | 37.000     | degrees C  | ok    | na        | na        | na        | na        | 87.000    | na
12-HD Max        | 35.000     | degrees C  | ok    | na        | na        | na        | na        | 60.000    | na
13-Chipset       | 55.000     | degrees C  | ok    | na        | na        | na        | na        | 105.000   | na
14-P/S 1         | 39.000     | degrees C  | ok    | na        | na        | na        | na        | na        | na
15-P/S 2         | 37.000     | degrees C  | ok    | na        | na        | na        | na        | na        | na
16-P/S 2 Zone    | 42.000     | degrees C  | ok    | na        | na        | na        | na        | 75.000    | 80.000
17-VR P1         | 43.000     | degrees C  | ok    | na        | na        | na        | na        | 115.000   | 120.000
18-VR P2         | 46.000     | degrees C  | ok    | na        | na        | na        | na        | 115.000   | 120.000
19-VR P1 Mem     | 39.000     | degrees C  | ok    | na        | na        | na        | na        | 115.000   | 120.000
20-VR P1 Mem     | 39.000     | degrees C  | ok    | na        | na        | na        | na        | 115.000   | 120.000
21-VR P2 Mem     | 41.000     | degrees C  | ok    | na        | na        | na        | na        | 115.000   | 120.000
22-VR P2 Mem     | 44.000     | degrees C  | ok    | na        | na        | na        | na        | 115.000   | 120.000
23-VR P1Vtt Zone | 38.000     | degrees C  | ok    | na        | na        | na        | na        | 90.000    | 95.000
24-VR P2Vtt Zone | 43.000     | degrees C  | ok    | na        | na        | na        | na        | 90.000    | 95.000
25-HD Controller | 76.000     | degrees C  | ok    | na        | na        | na        | na        | 100.000   | na
26-iLO Zone      | 40.000     | degrees C  | ok    | na        | na        | na        | na        | 90.000    | 95.000
27-LOM Card      | na         |            | na    | na        | na        | na        | na        | 100.000   | na
28-PCI 1         | na         |            | na    | na        | na        | na        | na        | 100.000   | na
29-PCI 2         | na         |            | na    | na        | na        | na        | na        | 100.000   | na
30-PCI 3         | na         |            | na    | na        | na        | na        | na        | 100.000   | na
31-PCI 4         | na         |            | na    | na        | na        | na        | na        | 100.000   | na
32-PCI 5         | na         |            | na    | na        | na        | na        | na        | 100.000   | na
33-PCI 6         | na         |            | na    | na        | na        | na        | na        | 100.000   | na
34-PCI 1 Zone    | 35.000     | degrees C  | ok    | na        | na        | na        | na        | 65.000    | 70.000
35-PCI 2 Zone    | 36.000     | degrees C  | ok    | na        | na        | na        | na        | 66.000    | 71.000
36-PCI 3 Zone    | 36.000     | degrees C  | ok    | na        | na        | na        | na        | 66.000    | 71.000
37-PCI 4 Zone    | na         |            | na    | na        | na        | na        | na        | 65.000    | 70.000
38-PCI 5 Zone    | na         |            | na    | na        | na        | na        | na        | 65.000    | 70.000
39-PCI 6 Zone    | na         |            | na    | na        | na        | na        | na        | 65.000    | 70.000
40-I/O Board 1   | 42.000     | degrees C  | ok    | na        | na        | na        | na        | 66.000    | 71.000
41-I/O Board 2   | na         |            | na    | na        | na        | na        | na        | 66.000    | 71.000
42-VR P1 Zone    | 33.000     | degrees C  | ok    | na        | na        | na        | na        | 95.000    | 100.000
43-BIOS Zone     | 48.000     | degrees C  | ok    | na        | na        | na        | na        | 90.000    | 95.000
44-System Board  | 39.000     | degrees C  | ok    | na        | na        | na        | na        | 80.000    | 85.000
45-SuperCap Max  | 29.000     | degrees C  | ok    | na        | na        | na        | na        | 65.000    | na
46-Chipset Zone  | 43.000     | degrees C  | ok    | na        | na        | na        | na        | 75.000    | 80.000
47-Battery Zone  | 41.000     | degrees C  | ok    | na        | na        | na        | na        | 75.000    | 80.000
48-I/O Zone      | 42.000     | degrees C  | ok    | na        | na        | na        | na        | 75.000    | 80.000
49-Sys Exhaust   | 39.000     | degrees C  | ok    | na        | na        | na        | na        | 75.000    | 80.000
50-Sys Exhaust   | 39.000     | degrees C  | ok    | na        | na        | na        | na        | 75.000    | 80.000
Fan 1            | 7.840      | percent    | ok    | na        | na        | na        | na        | na        | na
Fan 2            | 7.840      | percent    | ok    | na        | na        | na        | na        | na        | na
Fan 3            | 8.624      | percent    | ok    | na        | na        | na        | na        | na        | na
Fan 4            | 16.464     | percent    | ok    | na        | na        | na        | na        | na        | na
Fan 5            | 27.440     | percent    | ok    | na        | na        | na        | na        | na        | na
Fan 6            | 27.440     | percent    | ok    | na        | na        | na        | na        | na        | na
Power Supply 1   | 185        | Watts      | ok    | na        | na        | na        | na        | na        | na
Power Supply 2   | 0          | Watts      | ok    | na        | na        | na        | na        | na        | na
Power Meter      | 196        | Watts      | ok    | na        | na        | na        | na        | na        | na
Power Supplies   | 0x0        | discrete   | 0x0280| na        | na        | na        | na        | na        | na
Fans             | 0x0        | discrete   | 0x0180| na        | na        | na        | na        | na        | na
Memory           | 0x0        | discrete   | 0x4080| na        | na        | na        | na        | na        | na
C1 P1I Bay 1     | 0x1        | discrete   | 0x0180| na        | na        | na        | na        | na        | na
C1 P1I Bay 2     | 0x1        | discrete   | 0x0180| na        | na        | na        | na        | na        | na
C1 P1I Bay 3     | 0x1        | discrete   | 0x0180| na        | na        | na        | na        | na        | na
C1 P1I Bay 4     | 0x1        | discrete   | 0x0180| na        | na        | na        | na        | na        | na
C1 P2I Bay 5     | 0x1        | discrete   | 0x0180| na        | na        | na        | na        | na        | na
C1 P2I Bay 6     | 0x1        | discrete   | 0x0180| na        | na        | na        | na        | na        | na
C1 P2I Bay 7     | 0x1        | discrete   | 0x0180| na        | na        | na        | na        | na        | na
C1 P2I Bay 8     | 0x1        | discrete   | 0x0180| na        | na        | na        | na        | na        | na
weberjoh@nuc:~$
weberjoh@nuc:~$
weberjoh@nuc:~$ ipmitool -I lanplus -H 192.168.3.83 -U Testuser -P ThisIsThePassword power status
Chassis Power is on
weberjoh@nuc:~$

This is how it looks like in Wireshark. No session setup since it relies on UDP (port 623). The protocol is detected as IPMB and RMCP+ (display filters: ipmb and rmcp), while you can see some more flags in the Info column. It seems like encryption is used – but don’t ask me how.

On a Palo, it is detected as “rmcp”:

For more information about IPMI, have a look at these very detailed Wiki articles at Thomas-Krenn.AG.

HSRP Version 1 aka 0

It’s a common best practice to set standby version 2 whenever you’re using HSRP on a Cisco router. That’s why I only had those version 2 HSRP packets in the Ultimate PCAP. Nevertheless, I let out this version statement just to capture some HSRP version 1 packets, which are specified for IPv4 only. Obvious differences: the destination IPv4 multicast address is 224.0.0.2 (rather than 224.0.0.102) and Wireshark lists its protocol as HSRP rather than HRSPv2. Little confusion though the “version” field within the HSRP packets is set to 0. But this seems to be correct according to RFC 2281. (Captured out of GNS3, by the way.)

Zabbix Traffic

Thanks to Markku Leiniö I added some different Zabbix connections. Please refer to his GitHub repo or his blog posts concerning any details. As of now (Wireshark version 4.0) there is no official Zabbix dissector integrated.

Filtering for Pile of Poo

Just something funny at the end. At the keynote of the Wireshark conference “SharkFest” 2022 in Europe, Gerald Combs, the creator of Wireshark, talked about various new display filter possibilities, e.g., filtering for emojis such as the pile of poo. Challenge accepted. ;) Here is my proof of concept, or, as @noIPv6 has pointed out, it is a poo of concept. Search for  udp contains "?"  within the Ultimate PCAP and you’ll find it. Try it by yourself by doing a DNS lookup of “pile-of-poo.weberdns.de”.

Packet Comments

No protocol, but a Wireshark feature: you can add/read/edit/delete packet comments. Find some in my DHCP captures, for example. Either by using the display filter pkt_comment, by finding one of those packets (green bar within the packet details), or by a custom column:

Soli Deo Gloria.

Photo by Amber Flowers on Unsplash.

↧

Netzwerk-Monitoring: Ping und Traceroute richtig interpretieren

$
0
0

Klemmt es im Netzwerk, so helfen Ping und Traceroute, Fehler und EngpÀsse einzukreisen. Wir erklÀren die Funktionsweise und helfen Angriffe aufzudecken.

Diesen Artikel habe ich initial fĂŒr die c’t geschrieben, wo er im Heft 24/2022 erschienen ist. Als Autor habe ich dankenswerterweise die Erlaubnis, ihn hier auf meinem Blog ebenso zu veröffentlichen. Eine Übersicht der von mir geschriebenen c’t Artikel gibt es hier.

Unter den Befehlen fĂŒr Netzwerkanalysen gehören Ping und Traceroute zu den am hĂ€ufigsten verwendeten. Die Ping-Funktion ist schnell beschrieben: Mittels ping <hostname|ip> schicken Sie ICMP-Pakete vom Typ Echo-Request vom Client zu einem Ziel. Das Ziel antwortet mit Echo-Reply-Paketen. Im Konsolenfenster erscheint dann unter anderem die Antwortzeit in Millisekunden (ms). Sie gibt an, wie viel Zeit vom Versenden bis zum Empfang der Quittung verstrichen ist. Und sie gibt die genaue Dauer eines Ende-zu-Ende-Dialogs an, die Round Trip Time, RTT.

Wenn Sie Ping eine Weile laufen lassen (unter Windows mit dem Parameter -t,unter Unix standardmĂ€ĂŸig bis zum Abbruch per Strg+C), werden etwaige Stausituationen auf der betreffenden Internet-Strecke beziehungsweise Lastprobleme des angepingten Servers sichtbar. Aber Achtung: Ob eine entfernte Applikation ĂŒberlastet ist oder nicht antwortet, darĂŒber verrĂ€t Ping nichts.

Denn Ping-Pakete beantwortet der entfernte Netzwerk-Stack und die Ping-Laufzeit hĂ€ngt – sofern nachgelagerte Router nicht verstopft sind – nur davon ab, ob der Stack zur Ping-Beantwortung noch KapazitĂ€ten ĂŒbrig hat. Client-Anfragen an einen Service beantwortet hingegen die zugehörige Applikation und die Auslastungen der beiden Elemente hĂ€ngen nicht miteinander zusammen. Deshalb sollte man Fragen nach der Auslastung von Diensten mit Applikations-Pings wie httping, dnsping oder smtpping nachgehen.

c’t kompakt
  • Die Bedienung der Monitoring-Werkzeuge Ping und Traceroute ist zwar gut dokumentiert, nicht aber die Auswertung der Ergebnisse.
  • Vor allem bei Traceroute hilft Hintergrundwissen zu Backbone-Routern und zum Routing erheblich.
  • Traceroute-Messungen grĂŒnden auf ICMP-Meldungen, die ursprĂŒnglich fĂŒr ganz andere Dinge gedacht waren.

Der Traceroute-Befehl nutzt ein beim IPv6-Protokoll “Hop Limit” beziehungsweise bei IPv4 “Time To Live” genanntes Feld in den Headern der IP-Pakete. Beide hat man ursprĂŒnglich spezifiziert, um zu vermeiden, dass IP-Pakete endlos in versehentlich konfigurierten Routing-Loops kreisen und solche Loops verstopfen. Die Methode ist einfach: Der Absender gibt seinen IP-Paketen ein Hop Limit (maximale Anzahl von Zwischenstationen) von zum Beispiel 128 mit auf den Weg. Unterwegs dekrementiert jeder Router auf der Strecke den Wert um 1 und gibt dann das IP-Paket weiter. Kommt bei einem Router ein solches Paket mit Hop-Limit 0 an, muss er es verwerfen und dem Absender “Hop Limit Exceeded” melden. So ist gesichert, dass die IP-Pakete zwar weit reisen können, aber nicht endlos im Internet wabern und der Absender erfĂ€hrt, dass die betreffende Strecke eine Endlosschleife enthĂ€lt.

Der Befehl Traceroute nutzt diese Funktion, indem er IP-Pakete mit inkrementierendem Hop-Limit ab dem Wert 1 verschickt. So erzwingt Traceroute, dass sich alle Router auf dem Weg zum Ziel der Reihe nach melden; jeder einzelne schickt “Hop Limit Exceeded” zurĂŒck. Die Meldungen nutzt Traceroute, um die Laufzeit zu den Routern auf der Strecke zu ermitteln und ĂŒberhaupt, um die Router zu identifizieren. Windows verschickt mit dem Traceroute-Befehl so wie Ping ICMP-Echo-Request-Pakete, Unix-Implementierungen verwenden UDP-Pakete mit Source-Ports beginnend ab 33434. Um Firewall-Blockaden zu umgehen oder um Policy Based Routings zu erkennen, bieten sich Layer-4-Traceroutes (LFT) an.

Antwortzeiten und Traceroute

Lange Antwortzeiten

Kommen wir zur gĂ€ngigsten Fehlinterpretation von Traceroute: Schallt mal wieder der Ruf durchs Haus: “Schatz, das Internet is’ mal wieder lahm” und speziell die Verbindung zum Server X, schnappt man sich Traceroute und schaut sich die Antwortzeiten des Servers und der Router auf der Strecke dorthin an. Fallen die Antwortzeiten eines einzelnen Routers höher aus als bei den ĂŒbrigen, glaubt man, das Problem identifiziert zu haben: Dieser Router beziehungsweise dessen Verbindungen sind ĂŒberlastet. Oder noch schlimmer: Manche Router antworten gar nicht und erscheinen nur als Sternchen * in der Ausgabe. Dazu AuszĂŒge eines Beispiels:

tracert -4 -d netsec.blog

1 <1 ms <1 ms <1 ms 192.168.110.33
2  1 ms  1 ms <1 ms 192.168.7.1
3  5 ms  7 ms  3 ms 100.124.1.10
4  4 ms  3 ms  3 ms 100.127.1.147
5  5 ms  7 ms  3 ms 185.22.46.177
6  5 ms  3 ms  4 ms 80.81.192.239
7  8 ms  7 ms  7 ms 87.230.115.1
8  7 ms  7 ms  7 ms 87.230.114.4
9 35 ms 37 ms 35 ms 87.230.114.222
10  * * *  ZeitĂŒberschreitung der Anforderung.
11  7 ms  7 ms  7 ms 5.35.226.136

Dabei antwortet Hop Nummer 9 deutlich langsamer als vorherige Router und Hop Nummer 10 schweigt sogar. Hier ist doch eindeutig was kaputt im Internet, nicht wahr?

Leider weit gefehlt. Das erkennt man leicht daran, dass die Antworten des letzten Glieds der Kette konstant nach 7 ms eingehen. Dieser Wert steht fĂŒr die Gesamtlatenz der untersuchten Strecke.

Wie kommt es dann aber, dass einzelne Router dazwischen weit langsamer antworten? ZunĂ€chst mal ist die Annahme falsch, dass die Antwortzeiten der einzelnen Router direkt mit der Verzögerung dieser Pfadabschnitte zusammenhĂ€ngen. Denn tatsĂ€chlich bestehen moderne Hochgeschwindigkeitsrouter aus mindestens einer Data Plane und einer Control Plane. Das Weiterleiten von IP-Paketen, die PrimĂ€raufgabe von Routern, ĂŒbernimmt die Data Plane, eine durch spezielle Hardware wie ASICs optimierte Einheit, die ihren Job sehr effizient und schnell erledigt. Die Data Planes befördern im Internet jegliche IP-Datenpakete, auch ICMP-Anfragen.

Kommt nun ein IP-Paket mit einem Hop-Limit von 1 an, wird es nicht weitergeleitet. Stattdessen setzt die Data-Plane den Wert auf 0 und verwirft das Paket gemĂ€ĂŸ der Spezifikation. Es ist dann die Control Plane, die “Hop Limit exceeded” an die Quelladresse meldet. Control Planes sind jedoch weit langsamer als der Rest des Routers. Eine hohe Latenz in der Traceroute-Ausgabe lĂ€sst also lediglich auf eine Überlastung der ohnehin schwĂ€cheren Control-Plane schließen – ist aber kein harter Beleg fĂŒr einen Engpass im Routing. Und hat der Netzwerk-Admin eines Routers ICMP-Fehlermeldungen abgedreht, taucht dieser Router nur als Stern in der Traceroute-Ausgabe auf. Auch können ICMP-Antworten ausbleiben, wenn der Admin ein Rate-Limit gesetzt hat und der Schwellenwert bei Ihrer Messung gerade ĂŒberschritten ist. Derart konfigurierte Router geben also keinen RĂŒckschluss auf die Netzauslastung.

Wichtiges Detail: Anders als die ĂŒbrigen Traceroute-Messwerte liefert die letzte Ausgabezeile dieselbe Aussage wie ein konventioneller Ping an das Zielsystem. Diesen Messwert steuert nĂ€mlich der Netzwerk-Stack des EmpfĂ€ngers per Echo-Reply bei und nicht ein Router beziehungsweise dessen Control-Plane.

Wenn aber ab einem Hop sĂ€mtliche nachfolgenden Router beispielsweise um 100 Millisekunden langsamer sind als vorherige, dann ist die Wahrscheinlichkeit hoch, dass ab diesem Router tatsĂ€chlich eine lĂ€ngere Laufzeit fĂŒr alle Verbindungen besteht. Das kann man gelegentlich bei IP-Verbindungen beobachten, die per Unterseekabel um die halbe Welt gehen.

Traceroute-Wege

Wenn Sie klĂ€ren wollen, ob es in Ihrem Firmennetz oder auf einer Internet-Strecke klemmt, so ist auch hier Traceroute die erste Anlaufstelle. Aber Achtung: Einerseits ist in großen Netzwerken und erst recht im globalen Internet asymmetrisches Routing ĂŒblich, andererseits gibt Traceroute nur die Messwerte fĂŒr den Hinweg aus! Über den RĂŒckweg vom Server zum Client, welcher ja rund die HĂ€lfte der per Ping gemessenen Gesamtlaufzeit ausmacht, kann daher mit einer einfachen Traceroute-Messung keine Aussage getroffen werden.

Man kann nĂ€mlich nicht ausschließen, dass eine hohe Latenz ausschließlich auf ein lahmes RĂŒckweg-Routing zurĂŒckgeht. Um also sowohl den Hin- als auch den RĂŒckweg einer IP-Verbindung zu analysieren, braucht man zwei Traceroutes: Einen vom Client zum Server und einen vom Server zum Client (Applikations-Pings können nicht aufdecken, ob der Hin- oder der RĂŒckweg lahmt). DafĂŒr muss der Admin die Kontrolle ĂŒber beide Enden haben, was im Heim- oder Firmennetz oft der Fall ist. Bei fremden Servern, die irgendwo im Internet stehen, ist das in der Regel nicht möglich. Zudem verhindert bei IPv4 die verbreitete Network Address Translation, die in Routern zwischen der öffentlichen IP-Adresse und dem privaten Netzwerk vermittelt, die Messung des RĂŒckwegs zurĂŒck zum Client.

Wie ordnet ein PC mehrere gleichzeitige Traceroutes den jeweiligen Ausgaben zu? Antwort: In der ICMP-Meldung eines Routers (1 und 2), befindet sich der Anfang des originalen Pakets, hier ein klassischer Echo-Request (3 und 4). Das IP-Paket enthÀlt also zwei IPv6-Header und zwei ICMPv6-Pakete.

Dass sich zudem bei ICMP-Analysen Hinweg und RĂŒckweg (fĂŒr die Meldungen) ebenfalls unterscheiden können, sei nur ergĂ€nzend gesagt; sie können somit ebenfalls irrefĂŒhrende Messwerte liefern. Am Fazit Ă€ndert das wenig: Ein Traceroute liefert nur Hinweise, aber keine Beweise.

Und noch ein Eintrag fĂŒr das kleine Know-how-Heftchen: Router senden die Hop-Limit-Exceeded-Meldungen immer von dem Interface aus, an dem das ursprĂŒngliche Paket eingetroffen ist. Deshalb erscheinen in den Traceroutes je nach Verkehrsrichtung – stromauf- oder stromabwĂ€rts – verschiedene Absender-IP-Adressen. Das erschwert die Identifikation einzelner Router immens. Deshalb gebĂŒhrt jenen Providern Dank, die den IP-Adressen der Router-Interfaces konsistente Hostnamen geben (Reverse DNS mittels PTR Records im weltweiten Domain Name System). Ohne die bleibt man auf Mutmaßungen zurĂŒckgeworfen.

Ping und Routing

Ping-Verwirrung

Ping hat den Vorteil, dass die ausgegebene Zeit den vollstĂ€ndigen Hin- und RĂŒckweg abbildet. Dabei wird routingtechnisch genau derselbe Weg vermessen, den die Pakete von Applikationen entlang laufen, egal ob der aktuelle Pfad symmetrisch oder asymmetrisch ist. Vorsicht ist aber bei der Interpretation der TTL-Angabe geboten: Diese bezieht sich auf das vom Zielrouter neu verschickte Echo-Reply. Deshalb sagt dieser Wert nichts ĂŒber den Hinweg aus. Aussagen wie “durch die TTL der Ping-Antwort wissen wir, dass der Server so und so viele Hops entfernt ist” treffen nicht zu.

Vom Client zum Server geht es ĂŒber sieben Router (orange), zurĂŒck nur ĂŒber fĂŒnf (grĂŒn). Entsprechend unterscheiden sich die Traceroute-Ergebnisse. Auch beim Ping bitte genau hinschauen: Die TTL betrifft nur den RĂŒckweg.

Routing-Entscheidungen

Wieso gibt es ĂŒberhaupt asymmetrisches Routing? Hierzu muss man zunĂ€chst die Funktionsweise von Routern und deren Forwarding-Entscheidungen verstehen: Jeder Router pflegt eine eigene Routing-Tabelle. Darin stehen entweder statische Routen (selten, beziehungsweise nur in kleinen Netzen) oder EintrĂ€ge, die Protokolle wie OSPF (Open Shortest Path First in internen Netzen) oder BGP liefern (Border Gateway Protocol im weltweiten Internet).

Die Entscheidung, ĂŒber welchen Weg ein Zielnetzwerk erreicht wird, fĂ€llt jeder Router eigenstĂ€ndig anhand seiner Routing-Tabelle – unabhĂ€ngig von allen anderen Routern um ihn herum. Deshalb gilt: Nur weil Router A ein bestimmtes Zielnetz kennt, heißt das noch nicht, dass Router B dieses ebenfalls kennt. Und nur weil ein Router den Hinweg zu einem Zielnetz kennt, heißt das noch nicht, dass der RĂŒckweg ĂŒber die gleichen Router lĂ€uft.

Ein Netzwerk-Admin kann die Entscheidungen der einzelnen Router anhand diverser Parameter und deren Routing-Protokolle anpassen. Solange alle relevanten Netze zum gleichen Autonomen System (AS) gehören, hat der Admin volle Kontrolle. Wenn es allerdings um das Routing im Internet geht, wird es schwierig.

Beispielsweise kann eine Firma, die AnschlĂŒsse von zwei verschiedenen ISPs verwendet und daher ihre PrĂ€fixe per BGP bekannt gibt, bestimmen, dass ausgehender Verkehr bevorzugt ĂŒber Router 1 von ISP 1 lĂ€uft – den Router kontrolliert schließlich der Admin. Was die RĂŒckrouten betrifft, anhand derer alle möglichen Router dieser Welt ihre Routing-Entscheidungen treffen, wird es schwierig bis unmöglich – schließlich stehen diese Router unter der Kontrolle anderer Admins. Im Internet sind daher asymmetrische Pfade eher der Standard als die Ausnahme. Zwar kann man das Path Pretend von BGP nutzen, um draußen zum Beispiel mitzuteilen, dass externe Router fĂŒr die RĂŒckroute den Pfad ĂŒber ISP 2 nicht bevorzugen sollen. – viele ISPs richten sich sogar danach –, aber man kann es nicht erzwingen. De facto kommt Traffic trotzdem immer ĂŒber beide ISPs zurĂŒck.

Von einem Businessanschluss der Telekom mit fester öffentlicher IPv4-Adresse wurde ĂŒber einen lĂ€ngeren Zeitraum der Hop-Count zu einem DSL-Anschluss gemessen. Nach den Neueinwahlen betrug die Anzahl der Router entweder 13 oder 15.

Möchten Sie wissen, ĂŒber welche Autonomen Systeme Ihre IP-Verbindungen laufen? Lassen Sie Traceroute auf Unix mit der Option -A laufen, damit es die Nummern der AS (ASN) meldet. Technisch wird dabei die IP-Adresse des jeweiligen Routers per Whois-Befehl nachgeschlagen; die Adressen stecken in den Whois-Datenbanken von IP-Registraren wie dem RIPE. HĂ€ufig sind nur wenige Autonome Systeme beteiligt: Das AS Ihres ISP, ein bis zwei Transitnetzwerke sowie das AS des Ziels. Innerhalb eines AS-Netzwerks laufen die Pakete meist ĂŒber mehrere, dem jeweiligen AS unterstellte Router.

Ping mit Traceroute

Ein hervorragendes Tool fĂŒr das Netzwerk-Monitoring ist My traceroute, kurz mtr. Auf Linux installieren Sie es mit den Standard-Paketmanagern, auf macOS wahlweise via HomeBrew oder MacPorts. Windows Nutzer nehmen WinMTR. Das einfachste Befehlsmuster sieht wie bei ping oder traceroute aus: mtr heise.de.

In der Voreinstellung sendet das Tool sekĂŒndlich je 30 Ping-Pakete mit Hop-Limits von 1 bis 30. Es misst also den gesamten Pfad kontinuierlich und gibt die Antwortzeiten der einzelnen Hops in mehreren Spalten aus: letzter Ping, bester Wert, schlechtester Wert, Durchschnitt (Avg) und Standardabweichung (StDev).

Das Tool mtr kombiniert Ping und Traceroute. Die Messwerte gibt es in verschiedenen Spalten aus (1). Bei einer Lastverteilung ĂŒber verschiedene Strecken zeigt es mehrere Zeilen pro Hop an, wie hier bei den Hops 16ff (2). Router, die keine ICMP-Meldungen senden, sind als Zeilen ohne weitere Informationen aufgefĂŒhrt (3).

Damit lassen sich etwaige AusfĂ€lle auf dem Routingpfad live feststellen. Wenn ein paar Hops plötzlich schweigen und stattdessen Zeilen neuer Router auftauchen, dann ist das ein Beleg dafĂŒr, dass gerade ersatzweise eine neue Route eingeschlagen wurde.

Die zusĂ€tzliche Angabe des prozentualen Verlusts der Antwortpakete (Loss%) gibt einen Überblick ĂŒber die empfangenen ICMP-Meldungen. DrĂŒcken Sie die Taste D zwei Mal, um die Anzeige des Display Mode so umzuschalten, dass er die letzten Ping-Laufzeiten farblich hervorhebt.

Ändert man bei mtr den Display Mode, zeigt das Programm die Antwortzeiten als Zeitachse und zudem farblich abgesetzt an. Nicht antwortende Router sind mit Fragezeichen (1) gekennzeichnet. Hier dauern ab Hop Nummer 12 alle nachfolgenden Antworten deutlich lĂ€nger – ein Hinweis auf ein Unterseekabel (2). Dass einzelne Antworten fehlen, kommt oft vor und ist kein Beleg fĂŒr Fehler (3).

Angriffspunkt

In der Ausgabe von Traceroute sollte fĂŒr jedes Netzwerksegment genau ein Router stehen. Bei IPv6 ist das durch die festen /64er-Masken einfach zu erkennen, bei IPv4 haben Sie zumindest in Ihren eigenen Netzen die Möglichkeit herauszufinden, wie die Subnetzmasken lauten. Sollten mal in einem Segment zwei Router stehen, stimmt etwas nicht. Entweder haben Sie dort wirklich mehrere Router – dann verfĂŒgen nicht alle ĂŒber korrekte (statische) Routen – oder jemand hat einen Router als Man-in-the-Middle in Ihr Netz eingeschleust.

Dabei gibt sich ein Angreifer wahlweise via ARP-Spoof (IPv4) oder via NDP-Spoof (IPv6) als Default Router aus, wodurch er jedweden Traffic empfÀngt (Hop 1) und diesen an den echten Router weiterleitet (Hop 2), um die IP-Verbindungen nicht zu unterbrechen. So liest er alles mit, ohne gleich aufzufallen.

Aber was genau vorliegt, das bringen nur weitere Analysen zutage. Ein guter Startpunkt ist die Suche nach dem Switch-Port, an dem der verdĂ€chtige Router angeschlossen ist. Lesen Sie dazu im Client die MAC-Adresse des Default-Routers aus dem ARP-Cache aus und schauen Sie am Switch nach, ĂŒber welchen Port diese MAC angesprochen wird. Dann lesen Sie die MAC Ihres tatsĂ€chlichen Default-Routers aus und vergleichen diese mit der vom Client verwendeten. Wenn sich die beiden unterscheiden, verfolgen Sie das Kabel vom verdĂ€chtigen Switch-Port, um den ĂŒberzĂ€hligen und vermutlich eingeschleusten Router zu finden.

Ein Angreifer fĂŒhrt eine Man-in-the-Middle-Attacke aus, indem er sich als (Default-)Router ausgibt. Das liegt beispielsweise auf, wenn in Traceroute-Tests plötzlich ein zusĂ€tzlicher Router (Hop) auftaucht.

Eine Beispielausgabe fĂŒr ein Traceroute ohne zusĂ€tzlichem Router sieht so aus:

tracert 2001:db8:72ed:a9d7:ba3f:57be:af5b:de2f
1 <1 ms  1 ms  1 ms 2001:db8:72ed:46::1
2  1 ms  1 ms  1 ms 2001:db8:72ed:a9d7:ba3f:57be:af5b:de2f

Und so sieht die Ausgabe aus, wenn ein zusÀtzlicher Router im Segment steckt:

tracert 2001:db8:72ed:a9d7:ba3f:57be:af5b:de2f
1  1 ms <1 ms <1 ms 2001:db8:72ed:46:5d31:5dc1:315:13ef
2  1 ms  1 ms  1 ms 2001:db8:72ed:46::1
3  1 ms  1 ms  1 ms 2001:db8:72ed:a9d7:ba3f:57be:af5b:de2f

Wireshark und tcpdump

Ein letzter Tipp zum Abschluss: Wenn Sie den Verkehr mit Wireshark oder tcpdump mitschneiden, dann lohnt sich meistens die Angabe eines Capture-Filters, um nicht gleich alle, sondern nur die relevanten Pakete mitzuschneiden. GĂ€ngig sind Filter unter Angabe der Quell- und/oder Ziel-IP-Adressen sowie der TCP-/UDP-Ports, beispielsweise host 192.168.1.10 and host 8.8.8.8 and port 53.

Doch mit solchen Filtern fĂ€ngt man leider gar keine ICMP-Fehlermeldungen ein. Dabei ist leicht vorstellbar, dass ein Router auf dem Pfad nĂŒtzliche ICMP-Pakete sendet, die sogar beim mitschneidenden GerĂ€t ankommen – ohne geeigneten Filter werden sie aber ignoriert. Lösung: Immer den Zusatz or icmp or icmp6 an das Ende des Filters anhĂ€ngen. So greift man alle ICMP- und ICMPv6-Pakete ab (im Filter ohne v geschrieben, also icmp6), egal von welcher Quell-IP-Adresse sie stammen. So kommen Sie bei Ihrer spĂ€teren Analyse in Wireshark versteckten Problemen außerhalb der eigentlichen IP-Sessions auf die Schliche.

Soli Deo Gloria!

Photo by Chris Liverani on Unsplash.

↧

DHCPv6 Prefix Delegation

$
0
0

What is DHCPv6 Prefix Delegation? Coming from IPv4, you’re already familiar with DHCP (for IPv4) which hands out IPv4 addresses to clients. The same applies to (stateful) DHCPv6: it hands out IPv6 addresses to clients.

However, with IPv6 we’re heavily dealing with subnets rather than just single addresses. Again, you’re familiar with IPv4: For an IPv4-based ISP connection, you’re getting either a single public IPv4 address or a small subnet such as a /29, /28, or the like for your WAN interface. For an IPv6-based ISP connection, you’re getting a subnet which includes multiple unique subnets to be used for other layer 3 segments rather than a single address (with NAT on the CPE). This is where DHCPv6 prefix delegation (commonly abbreviated as DHCPv6-PD) kicks in: It hands out IPv6 subnets to routers.

Let’s have a closer look:

As always, a picture is worth a thousand words (click for full screen):


(The arrows in this sketch do not indicate the DHCPv6 protocol flow, but the direction of the information flow.)

That is: Your outer router or firewall (CPE) requests an IPv6 prefix from your ISP. This process occurs with DHCPv6 prefix delegation, RFC 8415, “DHCP for Prefix Delegation”. The delegating router also adds a route in its routing table according to the prefix and the link-local address of your router/firewall. Furthermore, your CPE must distribute /64 subnets out of the received prefix to its downstream interfaces, along with appropriate RAs.

Of course, it is possible to use a DHCPv6 relay from the ISP’s point of view. That is: Not the ISP router itself but an independent DHCPv6 server takes care of all prefixes.

The default prefix length that ISPs SHOULD give to an end site is a /48. However, ISPs tend to hand out /48 only to business customers while /56 to residential customers. Refer to RIPE-690 “Best Current Operational Practice for Operators: IPv6 prefix assignment for end-users – persistent vs non-persistent, and what size to choose”. Anyway:

It is strongly discouraged to assign prefixes longer than /56 unless there are very strong and unsolvable technical reasons for doing this.

DHCPv6 Prefix Delegation on the Wire

You can find DHCPv6 packets with prefix delegation in the Ultimate PCAP, display filter: dhcpv6.option.type == 25. Here’s a screenshot showing the “Advertise” message from the ISP router to the CPE from the end user. You can see the typical DHCPv6 address (Non-temporary Address, 3) along with the recursive DNS name server (23), as well as the additional “Identity Association for Prefix Delegation“, option number 25, which includes a /56 prefix in this example:

I have warned you!

Please note that you should always prefer a static IPv6 prefix!!! Using dynamic prefixes with DHCPv6-PD is ridiculous. It causes problems and instability – without any advantages. Why are (German) ISPs using it? 1) They are selling it as a privacy option đŸ€Š and 2) they want you to upgrade to a business connection. That’s it. Luckily, at least my ISP, Deutsche Glasfaser (FTTH), always delegates the same /56 prefix per customer. This is still done via DHCPv6 prefix delegation (which contains the name “dynamic” in it) but on a static basis. Thank you! Details about the connection establishment from them here (only in German).

Again: DO NOT USE an ISP connection with dynamic IPv6 prefixes for an enterprise. I’m serious. You will regret it!

However, speaking of residential ISP connections, we have to deal with it. :(

Soli Deo Gloria!

Photo by Ben White on Unsplash.

↧
↧

DHCPv6 Prefix Delegation on Palo Alto’s NGFW

$
0
0

Finally! With PAN-OS 11.0 a long missing IPv6 feature was introduced: DHCPv6-PD aka prefix delegation. For the first time, we can now operate a PAN-OS firewall directly on the Internet (the IPv6-Internet that is) on many kinds of ISP connections. Remember: To get a routed IPv6 prefix requires DHCPv6-PD (if you’re not a BGP-homed enterprise). Hence, without that feature, we could not connect to the Internet with a Palo directly.

With DHCPv6-PD, the firewall can receive a prefix from the ISP (commonly a /48 or a /56), while handing out /64s to downstream layer 3 interfaces. Here we go:

Please refer to my previous blog post about DHCPv6 prefix delegation in detail.

My Setup

I’m sitting behind a fibre ISP connection from Deutsche Glasfaser. The ethernet1/1 interface is directly attached to the fibre modem. I’m referring to it as my “WAN interface”. (More details about the connection establishment are available in German.) I’m using a PA-440 with PAN-OS 11.1.1. The client-facing interfaces ethernet1/3.24 and ethernet1/7 shall hand out /64 prefixes via RAs.

Configuration of the WAN Interface

At first, the WAN interface (ethernet1/1 in my case) is enabled for IPv6 with the type “DHCPv6 Client”. In my scenario, I set the request type to “Non-Temporary Address” only. In the second step, the prefix delegation is enabled (with a prefix length hint of 48 – just because I can) and a name for the pool:

I enabled DAD (Duplicate Address Detection) on the WAN interface (the best practice for firewall interfaces is to NOT activate it, but to be IPv6-compliant facing the ISP I would recommend it), enabled NDP monitoring, and enabled the DNS recursive name server and domain search list via DHCPv6 as well to get that information via DHCPv6:

Configuration of Host-Facing Interfaces

To let the Palo assign a /64 per host-facing interface, you have to enable IPv6 with the type “Inherited” and add a “GUA from Pool”. This is the pool you’ve created in step 2 above.

The assignment type can be “Dynamic” or “Dynamic with Identifier“. Note that you can’t mix those types within a single prefix pool. That is: you must either use dynamic on *all* host-facing interfaces, or dynamic with identifier again on *all* host-facing interfaces.

Since I wanted to test static subnet-IDs, I chose “dynamic with identifier”. Note that the identifier is a number from 0-4095 (decimal) converted to hexadecimal for the last three characters in the fourth hextet. (That is: This process on the NGFW is meant to deal with /52 prefixes turned into /64. Can’t we use /48 prefixes?!? This would require a range from 0-65535. Or even better: Why can’t we just type in hexadecimal values? That doesn’t seem to me to be fully developed here.)

Example: If your ISP-assigned prefix via DHCPv6-PD is 2001:db8:2311:a300::/56, choosing an identifier of 15 (decimal) will convert to an f (hex) and will end in the following host-facing prefix: 2001:db8:2311:a30f::/64. Since I wanted to see a 24 as the subnet-ID to follow my VLAN, I chose an identifier of 36. The name of this “Assign Addr” portion is not relevant at all.

Address resolution and router advertisement as always (no M nor O flag in my lab):

On my first host-facing interface, ethernet1/3.24, I set the DNS support to manual to use statically configured recursive DNS servers and my own search list. (I’m using Google’s public DNS64 servers here since this subnet is IPv6-only with NAT64. More on this in upcoming blog posts.) On another subnet, ethernet1/7, I chose the DHCPv6 type as the recursive DNS server to use the ISP-provided recursive DNS server which came in via DHCPv6, while I did not want to use the provided DNS search list in my lab, hence I left it unchecked:

Further Less reading from PANW: DHCPv6 Client with Prefix Delegation.

Show It To Me Baby! (uh huh, uh huh)

Within the well-known Network -> Interfaces -> Ethernet view you can click on “Dynamic-DHCPv6 Client” for information about the WAN interface and on “IPv6-Inherited” for the host-facing interfaces:

Let’s start with the WAN interface. This “DHCPv6 Client Runtime Info” lists the client (1) and server (2) DHCPv6 information aka DUID, the IPv6 address of the interface itself (3) with its default gateway (4), along with the recursive DNS servers (5). Finally, the IPv6 prefix (6) which is why we are all here:

A further click on “Show Prefix Pool Assignment” lists all the dynamically assigned /64 prefixes to downstream interfaces, in my case those two configured layer 3 interfaces. Note the last two hex values aka subnet-IDs of 24 (configured as decimal 36) and 43 (configured as decimal 67):

The “IPv6-Inherited” on a host-facing interface, in my case ethernet1/3.24, shows the parent interface (eth1/1), the inherited prefix, and so on:

Command Line Interface

On the CLI you can use several commands for further troubleshooting. (Remember that you can find commands with something like this: find command keyword dhcpv6)

For example:

show dhcp client ipv6 pool-details all
show dhcp client ipv6 state interface ethernet1/1
debug dhcpd show objects

That is:

weberjoh@pa> show dhcp client ipv6 pool-details all

Pool Name: DeuGlasfaser-Internet
Prefix: 2a00:6020:5004:2600::/56
Requesting Interface: ethernet1/1
Remaining Lease Time: 0 days 0:45:32
Preferred Lifetime (sec): 3600
Valid Lifetime (sec): 3600
IAID: 19010010
DUID: 00010001262c4077005056b18ad7
State: active
Delegated Interface(s):
 ethernet1/3.24
 ethernet1/7
Address Assignment(s):
  ethernet1/3.24   2a00:6020:5004:2624:667c:e8ff:fe8a:7912
  ethernet1/7      2a00:6020:5004:2643:667c:e8ff:fe8a:7916


weberjoh@pa>
weberjoh@pa> show dhcp client ipv6 state interface ethernet1/1

DHCPv6 Details:
  Interface: ethernet1/1
  Rapid Commit: Enabled
  State: BOUND
  Client:
    Address: fe80::667c:e8ff:fe8a:7910
    DUID: 000100012d86be01647ce88a7910 (Type: LLT)
  Server:
    Address: fe80::ff:fe01:101
    DUID: 00010001262c4077005056b18ad7
    Preference: 0
  Gateway: fe80::ff:fe01:101
  Remaining lease time: 0 days 0:42:41
  IPv6 Address (IA_NA):
    Address: 2a00:6020:1000:40::436
    Preferred Lifetime (sec): 3600
    Valid Lifetime (sec): 3600
  IPv6 Address (IA_TA):
  Delegated Prefix:
    IAID: 19010010
    IPv6 Prefix (IA_PD):
      Prefix: 2a00:6020:5004:2600::/56
      Preferred Lifetime (sec): 3600
      Valid Lifetime (sec): 3600
  DNS Server:
    2a00:6020:100::1
    2a00:6020:200::1
  DNS Suffix:

Counters:
  DHCPv6 control packets received: 10
  DHCPv6 control packets sent: 11
  RA control packets received: 20
  RS control packets sent: 1


weberjoh@pa>
weberjoh@pa> debug dhcpd show objects

--------------DHCP CFG OBJS---------------
CFG obj itf name: ethernet1/1 (0x7f9858088440)

--------------DHCP RT OBJS---------------
RT obj name: ethernet1/1 (0x7f9860007160)
  obj addr:0x7f9860007160
  enabled:1
  create def route:1
  def route metric:10
  server mac: 02:00:00:01:01:01
  Retry number:0
  Elapsed seconds:1583
  State:Bound

--------------DHCPV6 CFG OBJS---------------
CFG obj itf name: ethernet1/1 (0x7f9858089c00)

--------------DHCPV6 RT OBJS---------------
DHCPv6 client: ethernet1/1, if_index: 16, rt: 0x7f9864007160
General:
  vr_id: 1, b_enabled: 1
  pointer address             : 0x7f9864007160
  IP Address                  : 2a00:6020:1000:40:0:0:0:436
  Server ID                   : 0:0:0:0:0:0:0:0
  Link local Addr             : fe80:0:0:0:667c:e8ff:fe8a:7910
  Gateway                     : fe80:0:0:0:0:ff:fe01:101
  Trans ID                    : 0xf6f3bd
  Client DUID                 : 000100012d86be01647ce88a7910 (length: 14, duid_type: LLT)
SLAAC Data:
  opaque_data: 0x7f9864007160, ifindex: 16, name: ethernet1/1, mac: 64:7c:e8:8a:79:10
  autoconfig: disable, dhcpv6: enable
  managed flag: true, address: 0:0:0:0:0:0:0:0
Config parameters:
  Accept-RA                   : Enabled
  Rappid Commit               : Enabled
  default_route_metric        : 10
  Preference                  : high
Server Info:
  Client mac | Server mac     : 64:7c:e8:8a:79:10 | 02:00:00:01:01:01
  Hostname                    :
  Server DUID                 : 00010001262c4077005056b18ad7 (length: 14)
  DHCP6 Server IP             : fe80:0:0:0:0:ff:fe01:101
  Lease value | Lease used    : 3600 | 1089
  Lease until | Current epoch : 65f440cc | 65f436fd
  DHCP6 state                 : BOUND
Retransmission parameters:
  Retry timer not running
Timer values of IAs (minimum) calculated:
  T1 | T2 | PT | VT           : 1800 | 2880 | 3600 | 3600
  Lease timer (valid lt)      : value: 3600, elapsed: 1089, remaining: 2511
  T1 timer (renew)            : value: 1800, elapsed: 1089, remaining: 711
  T2 timer (rebind)           : value: 2880, elapsed: 1089, remaining: 1791
IA_NA:
  IA Addr                     : 2a00:6020:1000:40:0:0:0:436
  IAID | T1 | T2 | PT | VT    : 03010010 | 1800 | 2880 | 3600 | 3600
IA_PD:
  IA Prefix                   : 2a00:6020:5004:2600:0:0:0:0/56
  IAID | T1 | T2 | PT | VT    : 19010010 | 1800 | 2880 | 3600 | 3600
Other Info:
  DNS List                    : Enabled (Server)
  DNS List, count             : 2 (list ptr: 0x0x7f986008a8d0)
    0                         : 2a00:6020:100:0:0:0:0:1 (lifetime: 0)
    1                         : 2a00:6020:200:0:0:0:0:1 (lifetime: 0)
  Suffix List                 : Enabled (Server)
  Suffix List, count          : 0 (list ptr: 0x(nil))
------------------------------------------


weberjoh@pa>

A Client’s Perspective

Following is a Wireshark screenshot from a router advertisement (RA, ICMPv6 message type 134) as seen by a client behind interface ethernet1/7. You can see the prefix with the correct subnet-ID of 43 within the “ICMPv6 Option: Prefix information”, as well as 2x the “Recursive DNS Server” which are the ones from my ISP gathered via DHCPv6:

However, note that the “Prefix” shows the full IPv6 address of the PANW interface rather than the first 64 bits only (with all other bits set to zero) which violates the standards (RFC 4861 “Neighbor Discovery for IP version 6 (IPv6)”, section 4.6.2):

The bits in the prefix after the prefix length are reserved and MUST be initialized to zero by the sender and ignored by the receiver.

What’s still missing?

With PAN-OS 11.1, Palo Alto Networks has added another IPv6 feature: IPv6 support for PPPoE. This was still missing in PAN-OS 11.0. With this feature, you can now operate a PAN-OS firewall directly on the WAN connection of residential ISPs. (I reported those missing features back then in 2015. 😂)

So, are we feature complete now? Unfortunately not. We are still missing a DHCPv6 server on PAN-OS. And, please, not only for IA_NA (Identity Association for Non-temporary Addresses) but also for IA_PD (Identity Association for delegated prefixes) as well! That is: DHCPv6-PD server-side. Yay.

And, we are missing DNS64 as well. This could easily be done within the DNS proxy. It would round up the IPv6 completeness of PAN-OS firewalls since all the other features such as RA with RDNSS/DNSSL and NAT64 are already there.

(A little fun fact at the end: The late Juniper ScreenOS firewalls had a working DHCPv6-PD implementation a decade ago! I blogged about it here in 2015, for example.)

Soli Deo Gloria!

Photo by Jamie Templeton on Unsplash.

↧

Optimized NAT46 Config on a FortiGate

$
0
0

Johannes published a basic NAT46 configuration for a Fortigate firewall with FortiOS 7.0 some time ago. I run such a service (legacy IPv4 access to IPv6-only resources) since FortiOS 5.6, which means more than six years; lastly with FortiOS 6.4. It’s running for more than 100 servers without any other problems as we see them with IPv4 only or dual stack services.

But we weren’t happy with the basic configuration example by Fortinet. We wanted some NAT46 sample configuration with more details, that is: including the original source IPv4 address within the synthesized/SNATted IPv6 address. More in this post, after a short story about my way to a running nat46 configuration with port forwarding in FortiOS 7.2.x.

Note that this post is one of many related to IPv6. Click here for a structured list.

(Please note: this post is about NAT46, not NAT64, which is more common. :))

We operate a firewall which is doing NAT46 for many of our hosting services. All servers have IPv6 GUA (Global Unicast Addresses) and we are happy with the configuration. It looks like this:

Bear the Challenge and Update the FortiGate

Now, Fortinet support asked me, because of an issue we opened a ticket, to update my productive firewall (with the nat46 configuration!) to FortiOS 7.0 or 7.2 soon. I didn’t want to do this step since I read the first 7.0.1 release notes in summer 2021. This is because Fortinet changed the whole NAT64 and NAT46 configuration with policy46, vip46 and vip64 and so on. You will lose all of your configuration for IPv4-IPv6 translation features, not written there word by word, but as a result. They call this “simplify policy and routing configurations” at Fortinet in their Release Notes. And of course, as you already expect: the transfer of the nat46/nat64 configuration from a 6.x operating system to the new 7.x configuration is not a simple clicking around.

During the update process, there is no automatic transfer of the ip pools for nat64 and nat46, and no transfer of the nat64 and nat46 policies. After the first boot with 7.0.x, you only get a hint like this on the console:

The config file may contain errors,
Please see details by the command 'diagnose debug config-error-log read'

As I always strongly recommend when you get this line: run the debug command before the next reboot! There you find a short hint about the ignored transfer of some configuration sections; in this case, as announced in the release notes:

fgtos70 # diagnose debug config-error-log read
→ → "set" "gui-nat46-64" "enable" @ root.system.settings:command parse error (error -61)
→ → "config" "firewall" "vip46" @ root:command parse error (error -61)
→ → "config" "firewall" "policy64" @ root:command parse error (error -61)
→ → "config" "firewall" "policy46" @ root:command parse error (error -61)
→ → "config" "system" "nat64" @ root:command parse error (error -61)
fgtos70 #

In my case, the configuration had around 800 lines less
 Ouch!

I didn’t want to wait and keep many services of our hosting offline for a longer time, so an additional reboot and an update from 7.0.13 to 7.2.6 was the next task.

With the help of a self-written search-and-replace script and some additional, manual changes, I had a text file with my whole nat46 configuration which I could import without any warnings or errors. BE HAPPY.

Optimized nat46 Configuration

Unfortunately, there are no examples with the well-known NAT46/SIIT IPv6-prefix 64:ff9b::/96 in many documentations. This 64:ff9b::/96 range is 32-bit wide (96 + 32 = 128 bit) and represents the whole (32-bit wide) IPv4 range in IPv6, used for NAT46 (and NAT64) and SIIT (see RFC 6052 and RFC 7755 and many others).

The IPv4 address is shown as a hexadecimal address in the last two hextets of the IPv6 address. This means: if you have the (example) IPv4 address 9.9.9.9 it converts to 64:ff9b::909:909 in IPv6 if you use it for NAT46/NAT64; IPv4 address 10.11.12.13 is translated to 64:ff9b::a0b:c0d.  And one more example: IPv4 192.0.2.240 is 64:ff9b::c000:2f0. This is also called a synthesized IPv4 address when the IPv4 address is included in the 64:ff9b address.

If you create an ippool6 object in FortiOS with “startip 64:ff9b::” and “endip 64:ff9b::ffff:ffff“, (remember: the whole 32-bit IPv4 Internet!) and use this IPv6 range as a pool for the NAT46 (poolname6 in the policy for NAT46), the Fortigate will include the synthesized IPv4 source address as the IPv6 source address.

That is: you can still see the original source address in your server logs rather than just one single SNATted address from the firewall itself.

The IPv6-only service you operate behind your nat46 firewall can write this address to the log and may help you solve problems. This is the way IPv6-only servers can still provide the service for IPv4-only clients.

Configuration Example with NAT46 and Port-Forwarding

Here is my configuration example, with port-forwarding by a nat46 policy. First, we must create an IPv6 pool with a size of 32 bit to nat the (whole source) IPv4 address to a (destination) IPv6 address:

config firewall ippool6
    edit "IPv6pool-for-nat46-with-full-32bit-IPv4-range"
        set startip 64:ff9b::0
        set endip 64:ff9b::ffff:ffff
        set comments "common NAT46-NAT64 range"
        set nat46 enable
    next
end

The next step is a service object. We need one virtual IP (vip) object for each port/service which has to be mapped from an IPv4 address to an IPv6 address. Here is the example for HTTP and HTTPS:

config firewall vip
    edit "nat46_testA:80"
        set extip 192.0.2.39
        set nat44 disable
        set nat46 enable
        set extintf "v100"
        set portforward enable
        set ipv6-mappedip 2001:db8:de0:f270::200
        set extport 80
        set ipv6-mappedport 80
    next
    edit "nat46_testA:443"
        set extip 192.0.2.39
        set nat44 disable
        set nat46 enable
        set extintf "v100"
        set portforward enable
        set ipv6-mappedip 2001:db8:de0:f270::200
        set extport 443
        set ipv6-mappedport 443
    next
end

Now we create an object for port-forwarding within the NAT46 object. The IPv4-address is 192.0.2.39, IPv4 port is 22200 and the IPv6 port is 22 (default SSH):

config firewall vip
    edit "nat46_testA:22"
        set extip 192.0.2.39
        set nat44 disable
        set nat46 enable
        set extintf "v100"
        set portforward enable
        set ipv6-mappedip 2001:db8:de0:f270::200
        set extport 22200
        set ipv6-mappedport 22
    next
end

For this type of port-forwarding an additional custom service object is required. This example is to forward port 22200, but not defined for which destination port:

config firewall service custom
    edit "nat46fwd22200tcp"
        set category "nat46forward"
        set comment "in use for nat46 port forward"
        set <strong>tcp-portrange 22200</strong>
    next
end

Finally, we can combine all the created objects in policies:

config firewall policy
    edit 461
        set srcintf "v100"
        set dstintf "v503"
        set action accept
        set nat46 enable
        set srcaddr "ExternalTestIPv4"
        set dstaddr "nat46_testA:80" "nat46_testA:443"
        set srcaddr6 "all"
        set dstaddr6 "all"
        set schedule "always"
        set service "HTTP" "HTTPS"
        set auto-asic-offload disable     #just for better demonstration, set to enable for production
        set ippool enable
        set poolname6 "IPv6pool-for-nat46-with-full-32bit-IPv4-range"
        set comments "HTTP/HTTPS access policy"
    next
    edit 462
        set srcintf "v100"
        set dstintf "v503"
        set action accept
        set nat46 enable
        set srcaddr "ExternalTestIPv4"
        set dstaddr "nat46_testA:22" 
        set srcaddr6 "all"
        set dstaddr6 "all"
        set schedule "always"
        set service "nat46fwd22200tcp" "SSH"   #we need both, the external tcp-port and the internal tcp-port
        set auto-asic-offload disable          #just for better demonstration, set to enable for production
        set ippool enable
        set poolname6 "IPv6pool-for-nat46-with-full-32bit-IPv4-range"
        set comments "SSH access policy with port forwarding"
    next
end

In policy 462 you can see the port-forwarding configuration. We need the service object nat46fwd22200tcp for the IPv4 mapped port and the SSH service object for the destination IPv6 service. Read the next section to see the internal process to understand, why the configuration needs this.

With this configuration, the IPv6-only daemon for SSH or HTTP/HTTPS can write the synthesized IPv4 address in the log and the marketing department can follow a client connection through the logs.

Until now I could not test the real effect of changing srcaddr6 and dstaddr6 from all to other values. Looking forward to get some feedback!

Bonus: Start of a Data Flow of a nat46 Connection

If you have a detailed look at the following lines (built-in tcpdump in FortiOS), you can see a new, hidden interface called naf.root (I expect root is the name of the vdom, it might be different if you have other vdoms) which is in use to help to translate IPv4 in IPv6 and back:

  • In line 4 the test-ssh-client opens an IPv4 connection to port 22200 with a syn.
  • In line 5 the syn packet is routed through the naf.root interface (still IPv4) and comes back in line 6 as an IPv6 packet to destination port 22 for SSH.
  • The packet was sent to the vlan 503 (line 7) which uses a port channel (line 8) and leaves the unit on physical interface x3 (line 9).

All other lines are very similar and I am only publishing a part of the connection here. And I’m very sorry: I did not understand why there is a naf.root out in line 5 and why it is a naf.root in in line 6; same for all other lines with naf.root. Feedback is welcome!

fgtos7 # diagnose sniffer packet any 'host 192.0.2.46 or 64:ff9b::c000:22e' 4 500 l
interfaces=[any]
filters=[host 192.0.2.46 or 64:ff9b::c000:22e]
11:17:41.267612 v100 in 192.0.2.46.59172 → 192.0.2.39.22200: syn 160445192 
11:17:41.267633 naf.root out 192.0.2.46.59172 → 192.0.2.39.22200: syn 160445192 
11:17:41.267635 naf.root in 64:ff9b::c000:22e.59172 → 2001:db8:de0:f270::200.22: syn 160445192 
11:17:41.267648 v503 out 64:ff9b::c000:22e.59172 → 2001:db8:de0:f270::200.22: syn 160445192 
11:17:41.267649 PCdmz out 64:ff9b::c000:22e.59172 → 2001:db8:de0:f270::200.22: syn 160445192 
11:17:41.267650 x3 out 64:ff9b::c000:22e.59172 → 2001:db8:de0:f270::200.22: syn 160445192 
11:17:41.267846 v503 in 2001:db8:de0:f270::200.22 → 64:ff9b::c000:22e.59172: syn 4075988132 ack 160445193 
11:17:41.267869 naf.root out 2001:db8:de0:f270::200.22 → 64:ff9b::c000:22e.59172: syn 4075988132 ack 160445193 
11:17:41.267870 naf.root in 192.0.2.39.22200 → 192.0.2.46.59172: syn 4075988132 ack 160445193 
11:17:41.267879 v100 out 192.0.2.39.22200 → 192.0.2.46.59172: syn 4075988132 ack 160445193 
11:17:41.267880 PCwan out 192.0.2.39.22200 → 192.0.2.46.59172: syn 4075988132 ack 160445193 
11:17:41.267880 x2 out 192.0.2.39.22200 → 192.0.2.46.59172: syn 4075988132 ack 160445193 
11:17:41.279083 v100 in 192.0.2.46.59172 → 192.0.2.39.22200: ack 4075988133 
11:17:41.279088 naf.root out 192.0.2.46.59172 → 192.0.2.39.22200: ack 4075988133 
11:17:41.279089 naf.root in 64:ff9b::c000:22e.59172 → 2001:db8:de0:f270::200.22: ack 4075988133 
11:17:41.279092 v503 out 64:ff9b::c000:22e.59172 → 2001:db8:de0:f270::200.22: ack 4075988133 
11:17:41.279093 PCdmz out 64:ff9b::c000:22e.59172 → 2001:db8:de0:f270::200.22: ack 4075988133 
11:17:41.279094 x3 out 64:ff9b::c000:22e.59172 → 2001:db8:de0:f270::200.22: ack 4075988133 
11:17:41.284112 v100 in 192.0.2.46.59172 → 192.0.2.39.22200: psh 160445193 ack 4075988133 
11:17:41.284116 naf.root out 192.0.2.46.59172 → 192.0.2.39.22200: psh 160445193 ack 4075988133 
11:17:41.284117 naf.root in 64:ff9b::c000:22e.59172 → 2001:db8:de0:f270::200.22: psh 160445193 ack 4075988133 
11:17:41.284120 v503 out 64:ff9b::c000:22e.59172 → 2001:db8:de0:f270::200.22: psh 160445193 ack 4075988133 
11:17:41.284121 PCdmz out 64:ff9b::c000:22e.59172 → 2001:db8:de0:f270::200.22: psh 160445193 ack 4075988133 
11:17:41.284122 x3 out 64:ff9b::c000:22e.59172 → 2001:db8:de0:f270::200.22: psh 160445193 ack 4075988133

Further sources: SIIT task of Tore Anderson on RIPE69 (Nov. 2014).

Photo by Ian Taylor on Unsplash.

↧

How to install Palo Alto’s PAN-OS on a FortiGate

$
0
0

It happens occasionally that a customer has to choose between a Palo and a Forti. While I would always favour the Palo for good reasons, I can understand that the Forti is chosen for cost savings, for example.

Fortunately, there is a hidden way of installing PAN-OS, the operating system from Palo Alto Networks, on FortiGate hardware firewalls. Here’s how you can do it:

I’m using a Fortinet FortiGate FG-501E for this demo with (formerly) FortiOS v7.2.8. I’m upgrading it to PAN-OS 11.1.1.

As always: Please save a backup of your current FortiGate configuration. During this upgrade process, the firewall will reboot and lose all of its configuration. It will start as a factory-resetted Palo Alto firewall.

The main step is to upload and reboot the FortiGate into an alternative image, that is: a PAN-OS image. For generic FortiGates, you must choose the KVM-based PAN-OS images. With the following CLI command on the FortiGate, you can download the image from an TFTP server and reboot into it:

execute restore image tftp PA-VM-KVM-11.1.1.qcow2 192.168.21.5

The whole process in my lab was as follows. Note that you have to acknowledge the upgrade to an “unsupported image”:

fg2 # execute restore image tftp PA-VM-KVM-11.1.1.qcow2 192.168.21.5
This operation will replace the current firmware version!
Do you want to continue? (y/n)y

Please wait... 

Connect to tftp server 192.168.21.5 ... 
##########################################################

Get image from tftp server OK.
Warning: Upgrading to an unsupported image. Do you want to proceed? (y/n)y

Checking new firmware integrity ... pass

Please wait for system to restart.

After the reboot, you’re in the normal startup configuration of a Palo Alto firewall. –> Connect to it via the default IPv4 address of 192.168.1.1 with username:password of admin:admin.

In the dashboard, you can see the model and serial number, which are the ones from my FortiGate in this case:

Funnily enough, all those different interface names are used as well, that is:

In the end, you’ve got a fully featured PAN-OS-based firewall with all of its advantages on your FortiGate hardware. Have a nice day!

Photo by Lindsay Henwood on Unsplash.

↧

Palo’s Mgmt-Intf is not usable with IPv6 anymore

$
0
0

Wow, that was unexpected: With PAN-OS 11.1 the out-of-band management interface of Palo Alto Networks firewalls doesn’t accept an IPv6 default route pointing to one of its own data interfaces anymore. That is: In most setups, you can’t use IPv6 for management purposes anymore. “Works as expected.” Wow. Really?

Setup

This is how we normally connect the management interface to one of the internal layer 3 interfaces/VLANs from the firewall itself (at least in small environments where the out-of-band management is not within its own dedicated infrastructure):

The default gateway for the management interface points to one of the IP addresses of a data interface of the same firewall. In my lab, the management interface settings look as follows:

Error

I upgraded a PA-440 from PAN-OS 11.0.3 to 11.1.1. After the reboot, the auto-commit was not able to succeed. It ended in an auto-commit loop. I did a “commit force” from the CLI which showed the following error:

In virtual-router default: Mgmt IPv6 GW 2a00:6020:5004:2621:0:0:0:1/128 is conflict with address 2a00:6020:5004:2621:0:0:0:1/64 on interface ethernet1/3.21.(Module: routed)
client routed phase 1 failure
Commit failed

After I changed the default gateway of the mgmt-interface (IPv6) to an unused IPv6 address, the commit succeeded. However, when changing it back to the correct default gateway (which is a layer 3 subinterface from the same firewall itself), the same error appears again.

Some notes:

  • I am using a logical router (not a virtual router). Hence I’m confused about this error since it reads “In virtual-router default: 
”
  • This configuration was fully valid and running with PAN-OS 11.0.3 and previous versions for the last decade!
  • The IPv6 default gateway from the mgmt interface is the IPv6 global unicast address from ethernet1.3/21. Same for IPv4 where it’s still working.
  • I also tried to change the IPv6 default gateway address to the link-local address of ethernet1.3/21, which resulted in the same error.

Reply from PANW

Of course, I opened a support ticket with Palo Alto Networks. It turned out that this behaviour is already known and working as expected starting with PAN-OS 11.1. WHAT?

Root Cause:
============
Kernel doesn’t allow local IPv6 address as Gateway. So when we try add one of the DP interface IPv6 address as management interface IPv6 gateway, it throws an error “Error: Gateway can not be a local address.” So we shouldn’t support something that is not supported by the kernel. Hence decided to prevent user to configure the DP interface as management default gateway.

Fix:
===========
– This is functioning as designed from the PAN-OS version 11.1.0.

I also requested and got the bug ID, but since it is internal only, I won’t publish it here.

At least the engineering team was instructed to write documentation about this. Hahaha.

Some Notes

  • Isn’t it a real “out-of-band management” since the very beginning? If it were a real separate management plane, this would not happen, because the management and data plane would be *separate*. Hence it’s not the case. Ups.
  • To my mind, this setup (routing the management traffic through the firewall itself) is quite common if not the de facto standard. Why is Palo Alto Networks refusing this setup?
  • Isn’t Palo Alto Networks testing PAN-OS upgrades before releasing them enough? I would have expected this error to be noticed. I’m talking about the upgrade from PAN-OS 11.0 to 11.1. Either through a pre-check (before installing the upgrade) or at least through release notes.
  • Though Palo Alto Networks was a little behind concerning IPv6 completeness for the last years (e.g., DHCPv6-PD was introduced with PAN-OS 11.0 while other vendors had it for a couple of years), the quality of their implementation was always very good. But now they have introduced a big deal when it comes to IPv6. Bugs like this are not helping while deploying IPv6 at the customers’ sites.
  • Why is it still working with legacy IP? That is: Which “kernel” upgrade brought them to this error?
  • As workarounds, you must use “Interface Mgmt” profiles to access the firewall via HTTPS/SSH/SNMP/API on data interfaces rather than on the management interface.
  • Furthermore, you must rely on legacy IP for all other services such as DNS, NTP, syslog, authentication servers, etc. <– That’s exactly what was IPv6-only in my lab. D’oh!

Just as an example, this is how my NTP went dead (status: error, reachable: no):

weberjoh@pa> show ntp

NTP state:
    NTP not synched, using local clock
    NTP server: 2001:470:1f0b:16b0::dcfb:123
        status: error
        reachable: no
        authentication-type: none
    NTP server: 2a00:6020:5004:2600:85da:7fd8:1a80:8c8c
        status: error
        reachable: no
        authentication-type: none

Too bad.

R.I.P. IPv6-only at Palo Alto Networks firewalls. 😱

Soli Deo Gloria!

Photo by Jussara Paulo on Unsplash.

↧
↧

AkustikdĂ€mmung im BĂŒro

$
0
0

Als Consultant im Homeoffice mache ich vor allem eins: Telefonieren und an Videokonferenzen teilnehmen, neudeutsch: Calls. Und es nervt mich total, wenn mein GegenĂŒber einen schlechten Ton hat. Also akutisch. Das verbaute Mikrofon im Notebook oder irgendwelche Raummikros gehen gar nicht. Gleichermaßen möchte ich selber auch nicht viele Stunden am Tag ein Headset aufhaben.

Was hilft: Ein Podcast-Mikrofon und eine gute Raumakustik, sprich: wenig Hall. Um letzteres habe ich mich die letzten Wochen gekĂŒmmert. Hier mein Erfahrungsbericht, Tonaufnahmen und Messergebnisse.

Meine Ausgangssituation: Ein relativ großer Raum (ca. 19 mÂČ FlĂ€che, Deckenhöhe: 2,45 m), Teppichboden, wenig Möbel, nur ein Fenster mit leichtem Vorhang. Entsprechend hallig ist es nun mal. Als Mikrofon am Arbeitsplatz kommt ein RØDE NT-USB Mini, schwebend am Arm, zum Einsatz. Der Teil des Mikrofons ist also schon mal gut abgedeckt. Was fehlte, was die AkustikdĂ€mmung.

DĂ€mmung

Das Suchen und Finden von einer geeigneten DĂ€mmung war gar nicht so einfach. ZunĂ€chst mal gibt es viele Begriffe dafĂŒr wie Akustikpaneele, Schallabsorber, BĂŒrodĂ€mmung, Schallschutz, usw. Und dann gefielen mir diese Standard Paneele aus dem Baumarkt, welche meist eine Holzimitation in dĂŒnnen Streifen auf schwarzem Hintergrund haben, einfach nicht. Die machen mich total wuschig. Nach viel Gesuche bin ich auf die Firma Silenti gestoßen, welche auch grĂ¶ĂŸere Panels in grau und weiß anbietet, die auch eine mir sinnvoll erscheinende Dicke von 5 cm Schaumstoff haben.

Im Endeffekt habe ich mich fĂŒr vier “Streifen” von je 2,0 * 0,58 Meter entschieden. Dies macht somit ca. 4,5 mÂČ DĂ€mmung, womit ich laut dem Mengenberechner von Silenti sogar ĂŒber den empfohlenen 3,5 mÂČ fĂŒr meine RaumgrĂ¶ĂŸe liege. Drei der Panels hĂ€ngen hinter mir und eines rechts an der Wand vor dem Bildschirm. Sprich: Die DĂ€mmung findet vor allem *hinter* mir statt, nicht in Sprechrichtung. Da das Mikrofon aber ohnehin in meine Richtung guckt, sollte das soweit passen. Eines der Panels wollte ich 10 cm gekĂŒrzt haben, weil eine Steckdose im Weg ist. Eine kurze RĂŒckfrage bei Silenti ergab, dass ich das genaue Maß einfach im Bestellprozess angeben soll und sie es mir ohne Zusatzkosten entsprechend kĂŒrzen (incl. der abgeschrĂ€gten 45° Phase). Danke!

Silenti hat mir fĂŒr die Leser des Blogs einen Gutscheincode von 5 % zukommen lassen. Danke dafĂŒr. ;) Wer von euch ebenso dort Panels bestellen möchte bekommt immerhin 5 % Rabatt per “weberblog5“.

Vorher/Nachher Tonaufnahmen

Um einen subjektiven Eindruck vom Raumklang zu bekommen habe ich sowohl vor als auch nach der Anbringung der Paneele eine kurze Aufnahme an meinem Schreibtisch gemacht. Einfach direkt in Audacity rein, fertig. Keine Nachbearbeitung und nichts. Hört selbst. Bei 32 Sekunden fĂ€ngt die “danach” Aufnahme an:

Hier noch rein die drei Klatscher fĂŒr einen direkten A/B-Vergleich:

Mega! Ein deutlicher Unterschied.

Wer misst, misst Mist 😉

Nun bin ich weit davon entfernt, ernsthafte Audiomessungen bei mir durchzufĂŒhren. Dennoch wollte ich meinem subjektiven Eindruck auch etwas ObjektivitĂ€t verleihen. DafĂŒr habe ich mich in die Room Acoustics Software REW eingearbeitet und mir sagen lassen, dass vor allem der RT60 (Option T20) Graph interessant sein soll. Mein Mikrofon befand sich an der normalen Position auf Mundhöhe vor mir am Schreibtisch, als Lautsprecher habe ich meinen Bose SoundLink Mini genommen, unterhalb des Bildschirms positioniert. (Sicherlich keine optimale Wahl, aber fĂŒr einen vorher/nachher Vergleich ausreichend.) Ich selbst saß wĂ€hrend der Messung am Schreibtisch – schließlich spiegelt das meinen Alltag wieder.

Folgender Graph zeigt also die Nachhallzeit pro Frequenz. RT60 heißt: die Zeit, die es fĂŒr 60 dB Abfall braucht. KĂŒrzer ist besser. Ihr seht meine Messungen ohne DĂ€mmung (grĂŒne Linie) und mit DĂ€mmung (orange Linie):

Es ist sehr deutlich zu sehen, dass der Raumhall quasi ĂŒber das gesamte Frequenzspektrum abenommen hat. Sauber! Unter 400 ms soll wohl gut sein, bei <300 ms sind es Studiobedingungen, was bei mir ab ca. 600 Hertz tatsĂ€chlich auch der Fall ist. Warum die tiefen Frequenzen um 60 Hertz jetzt weniger stark abfallen bzw. sogar lĂ€nger im Raum nachhallen erschließt sich mir nicht.

Anyway: Q.E.D.

Fazit

ZunĂ€chst mal bin ich optisch mit der Lösung sehr zufrieden. Auch der WAF ist hoch. (Happy wife – happy life.) Aber das ist natĂŒrlich reine Geschmacksache. Viel wichtiger: Die Akustikeigenschaften des BĂŒros sind merklich besser. Allein wenn man den Raum betritt merkt man sofort einen großen Unterschied zu vorher. Ich fĂŒhle mich gleich viel wohler. Es herrscht einfach mehr Ruhe.

Letztendlich merke ich bei langen Calls oder gar Schulungen, in denen ich viele Stunden am StĂŒck rede, dass es angenehmer ist zu Arbeiten. Ich kann die Vorhörfunktion angehem laut aufdrehen, ohne dass der Raumhall stört. Auch das Aufnehmen von Podcasts lĂ€uft jetzt ordentlich und ohne weitere Umbaumaßnahmen ab – Hörprobe hier.

Soli Deo Gloria.

Photo by Jonathan Farber on Unsplash.

↧

Some more Mail Captures

$
0
0

Email is still the most common communication protocol on the Internet. And since I was missing some variants of the related protocols, IMAP, POP3, and SMTP in the Ultimate PCAP, I did some captures. ✅ Here are a few details.

While there were already basic IMAP and SMTP sessions in the Ultimate PCAP, I was missing all those different kinds of cryptographically secure variants, that is, those STARTTLS (opportunistic/explicit TLS on common port) respectively implicit TLS (specific port) ones. I used the mail client Mozilla Thunderbird version 102.15.1 with different settings. All sessions took place with the standard Internet protocol IPv6. I always refreshed the inbox once without and a second time with a new mail in the inbox, while I sent two emails for the SMTP captures.

As always, you can find those packets in the Ultimate PCAP. Analyze it by yourself! đŸ‘đŸ» Note that the display filters within Wireshark (like “imap” or “pop”) only work for the clear text and STARTTLS variants, while the implicit TLS sessions completely mask the embedded protocol. At these points, you have to go over the TCP ports or the IP addresses of the involved hosts. Here’s a table listing the default ports for all of these protocols.

IMAP

“The Internet Message Access Protocol (IMAP) is an Internet standard protocol used by email clients to retrieve email messages from a mail server over a TCP/IP connection”, Wikipedia. You should all know the protocol. The well-known TCP port for the plain text and STARTTLS variants is 143. Watch out for the STARTTLS message within the tcp.stream:

While the implicit TLS variant uses TCP port 993. “imap” as a display filter is useless unless you’re decrypting your TLS connection within Wireshark. ;)

POP3

“The Post Office Protocol (POP) is an application-layer Internet standard protocol used by e-mail clients to retrieve e-mail from a mail server”, Wikipedia. While POP3 is the de facto default, the display filter in Wireshark is simply “pop”. Same as with IMAP: using a display filter with the destination port is more useful than the name of the application layer protocol.

Implicit TLS takes place on port 995. The second screenshot shows an unencrypted POP3 session just to prove again that it’s a good idea to encrypt your communication. ;)

SMTP

Finally, the Simple Mail Transfer Protocol (SMTP) sends out emails from a client (mail user agent, MUA) to a mail submission agent (MSA). This “mail submission” is done on TCP port 587 for plain text and STARTTLS (rather than on port 25 which is used for MTA -> MTA traffic):

SMTP submission with implicit TLS on TCP port 465:

That’s it. ;)

Soli Deo Gloria!

Photo by sue hughes on Unsplash.

↧

Dynamic DNS on a Palo

$
0
0

With PAN-OS 9.0 (quite some time ago), Palo Alto Networks has added Dynamic DNS for a firewall’s interfaces. That is: If your Internet-facing WAN interface gets a dynamic IP address via DHCP or PPPoE (rather than statically configured), the firewall updates this IP address to a configured hostname. The well-known DynDNS providers such as Dyn (formerly DynDNS), No-IP, or FreeDNS Afraid are supported. Since the Palo supports DHCP, PPPoE (even on tagged subinterfaces) as well as DHCPv6 respectively PPPoEv6, we can now operate this type of firewall on residential ISP connections AND still access it via DNS hostnames. Great. Let’s have a look at the configuration steps.

Spoiler: The DynDNS feature on a Palo only supports static IPv6 addresses rather than dynamic ones. đŸ€ŠđŸ€ŠđŸ€Š Yes, you haven’t misread. The DYNAMIC DNS feature does not support DYNAMIC IP addresses, but only STATIC ones. D’oh!

Pre-Notes & Use Cases

  • Don’t confuse this type of “DynDNS”, where a client updates an IP address through an API/HTTPS to a DNS provider who hosts public reachable DNS servers, with “Dynamic DNS“, where an internal client (Windows PC, DHCP-client) updates its IP address onto the internal authoritative DNS server through a standard UDP 53 DNS packet. Unfortunately, there is no strict naming convention and even the acronym “DDNS” is used in both scenarios. đŸ€Š
  • The main use case for DDNS on a Palo is GlobalProtect, that is: tunnelling home. ;) While outgoing site-to-site VPNs (to counterparts with static IPs) were working all the time, you can now build a remote access VPN back to your small office/home office.
  • As IPv4 addresses run short, we are facing many residential ISPs that only offer native IPv6 while tunnelled/CGNATted IPv4. That is: No public IPv4 address on the WAN interface anymore – hence no options for incoming IPv4 connections. :(
  • Consequentially, IPv6 is a must. No big deal, since many remote workers have IPv6 on their mobile phones/tethering/ISPs anyway.
  • Unfortunately, residential ISPs tend to use “dynamic IPv6 addresses” on the WAN interface rather than static ones. (Along with dynamic IPv6 prefixes for the internal networks, which is even worse!)
  • In fact, my customer asked me to set up GlobalProtect on a residential ISP connection with dynamic IPv6 only. No IPv4 at all.
  • The other use case of a DDNS service is for IPv4 only: port forwardings aka DNATs to internal servers.

Basic Usage

I’m using a PA-440 with PAN-OS 11.2.0. The official docs about PANW’s DDNS are here. Prerequisites: 1) a DynDNS account by any of the supported vendors. I’m using No-IP these days. And 2) the root certificate of the CA that signed the vendor’s update URL. In my case, it is “dynupdate.no-ip.com” respectively the “DigiCert Global Root G2”. Import this certificate (✅ Trusted Root CA) and add a certificate profile referencing this root:

The interesting steps are under your WAN interface, ethernet1/1 in my case, Advanced -> DDNS. Enabling the settings and the service itself, selecting the vendor and your hostname along with the login credentials, as well as the just created certificate profile. If your WAN interface gets its IPv4 address via DHCP, you can select this type of address there:

After a commit, you can “Show Runtime Info” or simply dig your hostname:

C:\Users\Johannes Weber>dig palo.ddns.me

; <<>> DiG 9.17.15 <<>> palo.ddns.me
;; global options: +cmd
;; Got answer:
;; ->>HEADER<<- opcode: QUERY, status: NOERROR, id: 30149
;; flags: qr rd ra; QUERY: 1, ANSWER: 1, AUTHORITY: 0, ADDITIONAL: 1

;; OPT PSEUDOSECTION:
; EDNS: version: 0, flags:; udp: 1232
;; QUESTION SECTION:
;palo.ddns.me.                  IN      A

;; ANSWER SECTION:
palo.ddns.me.           51      IN      A       100.93.7.250

;; Query time: 4 msec
;; SERVER: 192.168.7.53#53(192.168.7.53) (UDP)
;; WHEN: Tue Jun 25 21:59:27 Mitteleuropïżœische Sommerzeit 2024
;; MSG SIZE  rcvd: 57

(The attentive reader has already recognised it: This “public” IPv4 is not a public one, but out of the 100.64.0.0/10 space which is used for CGNAT. There is no single reason why I should update this CGNAT address at all since I can’t reach it from the public Internet anyway. That’s why I have to rely on IPv6.)

The system log shows entries of type “ddns”:

Yep, works like a charm – at least for legacy IP. 😂

IPv6: DynDNS only for static IPs đŸ€Š

PAN-OS 11.0 brought us DHCPv6 (even with prefix delegation), while PAN-OS 11.1 brought us PPPoE client for IPv6. (Thanks for that!) However, PANW somehow forgot to add those dynamic IPv6 address variants backwards to the Dynamic DNS feature. Sad, but true.

And yes, my interface gets a public IPv6 address via DHCPv6. It’s not my lab that’s not working here, but a missing feature.

Why does a software engineer add an “IPv6” section to a *DYNAMIC* DNS feature, but only allows the selection of *STATIC* addresses? That doesn’t make sense at all. If your interface IPs are static, you can add them statically in your DNS anyway. The demand for a DynDNS feature is for *dynamic* addresses, not for static ones. Hence the name.

Ok, reading the docs (RTFM) reveals that missing feature as well:

[
] or IPv6 address changes (static address only) for the interface with a dynamic DNS (DDNS) service provider

Of course, I immediately opened a support ticket and got to a staff member who at least understood my problem. ;) I ended up with a feature request, FR ID: 23066. Does anyone want to bet with me when it will be implemented? 😂

Please note that I’m not talking about a dynamic prefix *behind* the firewall (where you would use something like a “dynamic prefix updater“), but only about the WAN interface IP address.

Conclusion

Again and again, that’s that type of “yes, the product supports IPv6” but is NOT feature complete compared to IPv4“.

Too bad that even PANW still lacks a fully supported IPv6 firewall. We need IPv6-only capable devices to advance IPv6 adoption, not “IPv6-ready” devices.

In the end, I was not able to fulfil the customer’s requirement, which was a GlobalProtect connection to a dynamic IPv6 address. :( That hurts.

Soli Deo Gloria!

Photo by Ross Findon on Unsplash.

↧
Viewing all 340 articles
Browse latest View live


<script src="https://jsc.adskeeper.com/r/s/rssing.com.1596347.js" async> </script>