![]()
Some years ago I wrote a blog post called “Basic syslog-ng Installation“. While I used it myself quite often in my labs or at the customers’ sites, it shows only basic UDP transport which is both unreliable and insecure. So, let’s have a look at a fresh installation of syslog-ng with TLS support for security reasons. However, TCP and UDP as transport are covered as well for the support of legacy systems.
Prerequisite: X.509 Certificate
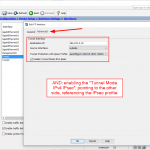
The secure transport of log messages relies on a well-known TLS connection. Therefore, the server needs a valid X.509 certificate, commonly known as a TLS certificate or the like. Of course, the server needs the certificate plus its corresponding private key. ;) If you are an enterprise, you can generate/sign a certificate as always within your PKI. If you don’t have your own PKI but still want to use a trusted certificate, you can use Let’s Encrypt, e.g., with the acme.sh script. (Out of scope for this blog post.)
The easiest way is to generate a self-signed certificate for this use case:
- use the FQDN of the syslog server as the common name
- the subject alternative names (SAN) should contain the FQDN as well, and additionally the IP addresses of the server (if your syslog clients use the IP address of the server rather than the FQDN, which is likely)
- though modern browsers only accept certificates that have a lifetime < 1 year, I don’t see this requirement here. Hence I am using 3 years as the lifetime.
TL;DR: Use the following OpenSSL command to generate your certificate. Replace the FQDN and the IP addresses according to your needs:
openssl req -x509 -newkey rsa:2048 -sha256 -days 1096 -nodes -keyout syslog.key -out syslog.crt -subj "/CN=syslog.weberlab.de/C=DE/O=Webernetz.net" -addext "subjectAltName=DNS:syslog.weberlab.de,IP:194.247.5.27,IP:2001:470:1f0b:16b0:20c:29ff:fea8:26f7"
You’ll have two files: syslog.crt and syslog.key. Optionally, you can verify that the .crt file starts with —–BEGIN CERTIFICATE—– while the .key file starts with —–BEGIN PRIVATE KEY—–.
Installation
I am using a Ubuntu 20.04.2 LTS version for this guide. It all starts with:
sudo apt update
sudo apt install syslog-ng
On my fresh Ubuntu, this installed 33 new packages. After the installation, the syslog-ng daemon is already running, though not listening on any interfaces:
weberjoh@vm32-test2:~$ sudo systemctl status syslog-ng.service
● syslog-ng.service - System Logger Daemon
     Loaded: loaded (/lib/systemd/system/syslog-ng.service; enabled; vendor preset: enabled)
     Active: active (running) since Wed 2021-06-16 10:55:32 UTC; 2min 59s ago
       Docs: man:syslog-ng(8)
   Main PID: 19666 (syslog-ng)
      Tasks: 3 (limit: 38436)
     Memory: 11.9M
     CGroup: /system.slice/syslog-ng.service
             └─19666 /usr/sbin/syslog-ng -F

Jun 16 10:55:32 vm32-test2 systemd[1]: Starting System Logger Daemon...
Jun 16 10:55:32 vm32-test2 syslog-ng[19666]: DIGEST-MD5 common mech free
Jun 16 10:55:32 vm32-test2 systemd[1]: Started System Logger Daemon.
Use
syslog-ng -V to see the installed version. In my case, it’s 3.25.1.
Configuration
Concerning the two certificate files: Change the ownership to root:root, make a folder for them within the syslog-ng folder and move them to that place:
sudo chown root:root syslog.*
sudo mkdir /etc/syslog-ng/cert.d
sudo mv syslog.* /etc/syslog-ng/cert.d/
For the following TLS related config snippets, I used the “syslog-ng Open Source Edition 3.30 – Administration Guide“.
I am using a single configuration file within the “conf.d” subfolder:
sudo nano /etc/syslog-ng/conf.d/generic.conf
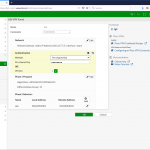
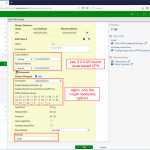
Using the following content, the service will listen for IPv6 and IPv4 on UDP (514), TCP (514) and TLS (6514), while creating a new folder for each logging source, year & month, writing into a new file every day. Note that I am using the “syslog” driver for receiving IETF/RFC5424 messages rather than the old “network” driver for merely BSD/RFC3164:
##################################################
options {
        create_dirs(yes);
        owner(root);
        group(root);
        perm(0644);
        dir_owner(root);
        dir_group(root);
        dir_perm(0755);
};

##################################################
source s_network {
        syslog (
                ip-protocol(6)
                transport("udp")
                port(514)
        );
        syslog (
                ip-protocol(6)
                transport("tcp")
                port(514)
        );
        syslog (
                ip-protocol(6)
                port(6514)
                transport("tls")
                tls (
                        cert-file("/etc/syslog-ng/cert.d/syslog.crt")
                        key-file("/etc/syslog-ng/cert.d/syslog.key")
                        peer-verify(optional-untrusted)
                )
        );
};

##################################################
destination d_host-specific {
        file("/var/log/syslog-ng/$HOST/$YEAR/$MONTH/$HOST-$YEAR-$MONTH-$DAY.log");
};

##################################################
log {
        source(s_network);
        destination(d_host-specific);
};
Restarting the server:
sudo systemctl restart syslog-ng.service
Verifying that the service is listening on those three ports:
weberjoh@vm32-test2:~$ sudo ss -tulpen | grep syslog
udp    UNCONN  0       0                          *:514                 *:*      users:(("syslog-ng",pid=249051,fd=12)) ino:825039 sk:6 v6only:0 <->
tcp    LISTEN  0       255                        *:6514                *:*      users:(("syslog-ng",pid=249051,fd=25)) ino:825041 sk:7 v6only:0 <->
tcp    LISTEN  0       255                        *:514                 *:*      users:(("syslog-ng",pid=249051,fd=24)) ino:825040 sk:8 v6only:0 <->
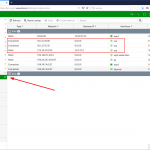
Basically, that’s it. ;) You can now point your clients to this syslog-ng server. When the very first syslog messages are received, the /var/log/syslog-ng and the corresponding subfolders will be created. For example, my syslog client with IP address 2001:470:7250::1 sending logs in June 2021 logs into:
/var/log/syslog-ng/2001:470:7250::1/2021/06.
Please note that logs coming through legacy IP connections are stored in the following way:
::ffff:<IPv4-address>. Have a look at this blog post for more details. Example:
weberjoh@vm32-test2:/var/log/syslog-ng$ ls -ahl
total 20K
drwxr-xr-x  5 root root   4.0K Jun 23 09:08 .
drwxr-xr-x 10 root syslog 4.0K Jun 23 07:37 ..
drwxr-xr-x  3 root root   4.0K May 20 08:06 ::ffff:192.168.3.53
drwxr-xr-x  3 root root   4.0K May 20 08:05 ::ffff:192.168.3.87
drwxr-xr-x  3 root root   4.0K May 20 08:05 ::ffff:194.247.5.1
drwxr-xr-x  3 root root   4.0K May 20 08:05 ::ffff:194.247.5.15
drwxr-xr-x  3 root root   4.0K May 20 08:05 ::ffff:194.247.5.16
drwxr-xr-x  3 root root   4.0K May 22 02:05 ::ffff:194.247.5.17
drwxr-xr-x  3 root root   4.0K May 20 12:36 ::ffff:194.247.5.26
TCP Port?!?
One question that took me some time: Which port is used for syslog-over-TCP? Normally, the same port as for UDP should fit, that is: 514. But the TCP port 514 is *not* registered for “syslog” but for “shell”, ref: IANA. This is unlike other common protocols such as DNS, where port 53 is registered for UDP and TCP. Uhm. RFC 1395 lists TCP port 601 for reliable syslog connections, which is listed at the IANA as well. However, RFC 6587 tells this:
The most frequently observed port for this has been TCP/514, which is actually assigned to the Shell protocol. Operators must carefully select which port to use in their deployment and be prepared to encounter different default port assignments in implementations.
TL;DR: Decide whatever you want, but maybe 514 is a good idea because everyone recognizes it as syslog. ;) A Twitter poll from me gave the same result:
Verification/Troubleshooting
You have multiple ways to troubleshoot the server and especially its TLS configuration. For example, you can use tcpdump to check if connections to ports 514 or 6514 are coming in at all (replace “ens160” with the name of your NIC):
sudo tcpdump -i ens160 port 6514 or port 514
Example connection on TCP 514:
weberjoh@vm32-test2:~$ sudo tcpdump -i ens160 port 6514 or port 514
tcpdump: verbose output suppressed, use -v or -vv for full protocol decode
listening on ens160, link-type EN10MB (Ethernet), capture size 262144 bytes
07:40:14.079021 IP6 2001:470:7250::1.43697 > vm32-test2.shell: Flags [P.], seq 2469074641:2469075198, ack 2549261998, win 113, length 557
07:40:14.079077 IP6 vm32-test2.shell > 2001:470:7250::1.43697: Flags [.], ack 557, win 501, length 0
07:40:16.082117 IP6 2001:470:7250::1.43697 > vm32-test2.shell: Flags [P.], seq 557:1099, ack 1, win 113, length 542
07:40:16.082154 IP6 vm32-test2.shell > 2001:470:7250::1.43697: Flags [.], ack 1099, win 501, length 0
07:40:19.889419 IP6 2001:470:7250::1.43697 > vm32-test2.shell: Flags [P.], seq 1099:1657, ack 1, win 113, length 558
07:40:19.889466 IP6 vm32-test2.shell > 2001:470:7250::1.43697: Flags [.], ack 1657, win 501, length 0
07:40:22.079816 IP6 2001:470:7250::1.43697 > vm32-test2.shell: Flags [P.], seq 1657:2190, ack 1, win 113, length 533
07:40:22.079857 IP6 vm32-test2.shell > 2001:470:7250::1.43697: Flags [.], ack 2190, win 501, length 0
07:40:22.904173 IP6 2001:470:7250::1.43697 > vm32-test2.shell: Flags [P.], seq 2190:2794, ack 1, win 113, length 604
07:40:22.904234 IP6 vm32-test2.shell > 2001:470:7250::1.43697: Flags [.], ack 2794, win 501, length 0
07:40:24.907202 IP6 2001:470:7250::1.43697 > vm32-test2.shell: Flags [P.], seq 2794:3361, ack 1, win 113, length 567
07:40:24.907286 IP6 vm32-test2.shell > 2001:470:7250::1.43697: Flags [.], ack 3361, win 501, length 0
Example connection on TLS via TCP 6514:
weberjoh@vm32-test2:~$ sudo tcpdump -i ens160 port 6514
tcpdump: verbose output suppressed, use -v or -vv for full protocol decode
listening on ens160, link-type EN10MB (Ethernet), capture size 262144 bytes
07:57:10.756095 IP6 ib2.weberdns.de.37703 > vm32-test2.syslog-tls: Flags [S], seq 3652917499, win 28800, options [mss 1440,sackOK,TS val 721716289 ecr 0,nop,wscale 8], length 0
07:57:10.756171 IP6 vm32-test2.syslog-tls > ib2.weberdns.de.37703: Flags [S.], seq 1815308753, ack 3652917500, win 64260, options [mss 1440,sackOK,TS val 527693389 ecr 721716289,nop,wscale 7], length 0
07:57:10.756420 IP6 ib2.weberdns.de.37703 > vm32-test2.syslog-tls: Flags [.], ack 1, win 113, options [nop,nop,TS val 721716289 ecr 527693389], length 0
07:57:10.756801 IP6 ib2.weberdns.de.37703 > vm32-test2.syslog-tls: Flags [P.], seq 1:160, ack 1, win 113, options [nop,nop,TS val 721716289 ecr 527693389], length 159
07:57:10.756825 IP6 vm32-test2.syslog-tls > ib2.weberdns.de.37703: Flags [.], ack 160, win 501, options [nop,nop,TS val 527693389 ecr 721716289], length 0
07:57:10.762989 IP6 vm32-test2.syslog-tls > ib2.weberdns.de.37703: Flags [P.], seq 1:1359, ack 160, win 501, options [nop,nop,TS val 527693395 ecr 721716289], length 1358
07:57:10.763184 IP6 ib2.weberdns.de.37703 > vm32-test2.syslog-tls: Flags [.], ack 1359, win 124, options [nop,nop,TS val 721716290 ecr 527693395], length 0
07:57:10.764690 IP6 ib2.weberdns.de.37703 > vm32-test2.syslog-tls: Flags [P.], seq 160:286, ack 1359, win 124, options [nop,nop,TS val 721716290 ecr 527693395], length 126
07:57:10.764713 IP6 vm32-test2.syslog-tls > ib2.weberdns.de.37703: Flags [.], ack 286, win 501, options [nop,nop,TS val 527693397 ecr 721716290], length 0
07:57:10.765486 IP6 vm32-test2.syslog-tls > ib2.weberdns.de.37703: Flags [P.], seq 1359:1585, ack 286, win 501, options [nop,nop,TS val 527693398 ecr 721716290], length 226
07:57:10.765764 IP6 ib2.weberdns.de.37703 > vm32-test2.syslog-tls: Flags [P.], seq 286:408, ack 1585, win 135, options [nop,nop,TS val 721716290 ecr 527693398], length 122
07:57:10.765791 IP6 vm32-test2.syslog-tls > ib2.weberdns.de.37703: Flags [.], ack 408, win 501, options [nop,nop,TS val 527693398 ecr 721716290], length 0
07:57:10.765871 IP6 ib2.weberdns.de.37703 > vm32-test2.syslog-tls: Flags [P.], seq 408:620, ack 1585, win 135, options [nop,nop,TS val 721716290 ecr 527693398], length 212
07:57:10.765891 IP6 vm32-test2.syslog-tls > ib2.weberdns.de.37703: Flags [.], ack 620, win 500, options [nop,nop,TS val 527693398 ecr 721716290], length 0
07:57:13.768417 IP6 ib2.weberdns.de.37703 > vm32-test2.syslog-tls: Flags [P.], seq 620:750, ack 1585, win 135, options [nop,nop,TS val 721716591 ecr 527693398], length 130
07:57:13.768475 IP6 vm32-test2.syslog-tls > ib2.weberdns.de.37703: Flags [.], ack 750, win 501, options [nop,nop,TS val 527696401 ecr 721716591], length 0
07:57:13.768527 IP6 ib2.weberdns.de.37703 > vm32-test2.syslog-tls: Flags [FP.], seq 750:874, ack 1585, win 135, options [nop,nop,TS val 721716591 ecr 527693398], length 124
07:57:13.768954 IP6 vm32-test2.syslog-tls > ib2.weberdns.de.37703: Flags [F.], seq 1585, ack 875, win 501, options [nop,nop,TS val 527696401 ecr 721716591], length 0
07:57:13.769085 IP6 ib2.weberdns.de.37703 > vm32-test2.syslog-tls: Flags [.], ack 1586, win 135, options [nop,nop,TS val 721716591 ecr 527696401], length 0
To check for the open ports, use Nmap from a different machine:
sudo nmap -Pn -sS -sU -p 514,6514 <FQDN-of-the-syslog-server>
Examples for IPv6 and legacy IP:
weberjoh@nb17-lx2:~$ sudo nmap -6 -Pn -sS -sU -p 514,6514 test2.weberlab.de

Starting Nmap 7.60 ( https://nmap.org ) at 2021-06-23 07:48 UTC
Nmap scan report for test2.weberlab.de (2001:470:1f0b:16b0:20c:29ff:fea8:26f7)
Host is up (0.00055s latency).
Other addresses for test2.weberlab.de (not scanned): 194.247.5.27

PORT     STATE         SERVICE
514/tcp  open          shell
6514/tcp open          syslog-tls
514/udp  open|filtered syslog
6514/udp closed        syslog-tls
MAC Address: 00:0C:29:A8:26:F7 (VMware)

Nmap done: 1 IP address (1 host up) scanned in 2.19 seconds
weberjoh@nb17-lx2:~$
weberjoh@nb17-lx2:~$
weberjoh@nb17-lx2:~$ sudo nmap -Pn -sS -sU -p 514,6514 test2.weberlab.de

Starting Nmap 7.60 ( https://nmap.org ) at 2021-06-23 07:48 UTC
Nmap scan report for test2.weberlab.de (194.247.5.27)
Host is up (0.00051s latency).
Other addresses for test2.weberlab.de (not scanned): 2001:470:1f0b:16b0:20c:29ff:fea8:26f7

PORT     STATE         SERVICE
514/tcp  open          shell
6514/tcp open          syslog-tls
514/udp  open|filtered syslog
6514/udp closed        syslog-tls
MAC Address: 00:0C:29:A8:26:F7 (VMware)

Nmap done: 1 IP address (1 host up) scanned in 1.85 seconds
It’s correct that UDP 514 is “open|filtered” and UDP 6514 is closed.
To verify the X.509 certificate you can use “openssl s_client”:
openssl s_client -connect <FQDN-of-the-syslog-server>:6514 -showcerts
In my case: (It’s using TLSv1.3 as you can see.)
weberjoh@nb17-lx2:~$ openssl s_client -connect test2.weberlab.de:6514 -showcerts
CONNECTED(00000005)
depth=0 CN = syslog.weberlab.de, C = DE, O = Webernetz.net
verify error:num=18:self signed certificate
verify return:1
depth=0 CN = syslog.weberlab.de, C = DE, O = Webernetz.net
verify return:1
---
Certificate chain
 0 s:CN = syslog.weberlab.de, C = DE, O = Webernetz.net
   i:CN = syslog.weberlab.de, C = DE, O = Webernetz.net
-----BEGIN CERTIFICATE-----
MIIDnjCCAoagAwIBAgIUO/WKKIVLZg/QTR2tFnV8z2pHgk0wDQYJKoZIhvcNAQEL
BQAwQjEbMBkGA1UEAwwSc3lzbG9nLndlYmVybGFiLmRlMQswCQYDVQQGEwJERTEW
MBQGA1UECgwNV2ViZXJuZXR6Lm5ldDAeFw0yMTA2MTYxMDU2NTVaFw0yNDA2MTYx
MDU2NTVaMEIxGzAZBgNVBAMMEnN5c2xvZy53ZWJlcmxhYi5kZTELMAkGA1UEBhMC
REUxFjAUBgNVBAoMDVdlYmVybmV0ei5uZXQwggEiMA0GCSqGSIb3DQEBAQUAA4IB
DwAwggEKAoIBAQDlS5BVOWOFRamFS8sAE7xIX0QBeFTJpckDJfjPCD5YBpbEZFV1
hvx5TTurroZhWuFTOJ2zDcVOAVr14Dd1WmB7nQZdy3w2Em/J5ZUfsUUnuHiOCtOE
TmEhiRivvZ8KspZnyi7Xl0X67y2YB1cConz+SwO3H3vdRg77jYut4y+01X0DyQ5B
evdjTQjm6s/SWa7kAG438uMSeskW+FfRMDuNOlfeXM6UgJ5gjykc+Ps0ENd77kJD
Ois5/HQP9DkHosqJDF90gTSEz+0JV0rEiLGP5X5dBrSfrrPW3pDnVMRKZXvAV4Ju
x5Aky6ULtctTFmcFwsVP8HWL4BZ8CpJMGNKrAgMBAAGjgYswgYgwHQYDVR0OBBYE
FBBVs9EKxGgbqlV+5xyiEuw3ZsudMB8GA1UdIwQYMBaAFBBVs9EKxGgbqlV+5xyi
Euw3ZsudMA8GA1UdEwEB/wQFMAMBAf8wNQYDVR0RBC4wLIISc3lzbG9nLndlYmVy
bGFiLmRlhwTC9wUbhxAgAQRwHwsWsAIMKf/+qCb3MA0GCSqGSIb3DQEBCwUAA4IB
AQB0poPFrYlu5uH9KdapqDQIJ/QPjpblneZBZ3tvguOvBKz/+5rPE/dNYiQ6L8b2
wxP8ks3YyjVIr8mhrRPwsZxg0rLe2DDeVqrp6JsxklPGTR0YL6q8x2JGFtLBzECy
R6VLR5EHWywTBnOzsIj3+9JiMO5y8LfjXhvLt4ljvevwNi50Ce+Oc8c30qdkAb8S
ALhRSaBhdmSZBpxp59yeD8RFgAH/pB9knuaLbt1MFc7AJ8Mwh0NJBlBllSBq49ft
Gw9YPU5WskcRQCfic0spgC8etpXdQ9doUvOpmAa3IJjQxn8PbCIV3Owx79TL/2gn
lTjvgGTf4XyktwwR8JkgCpj8
-----END CERTIFICATE-----
---
Server certificate
subject=CN = syslog.weberlab.de, C = DE, O = Webernetz.net

issuer=CN = syslog.weberlab.de, C = DE, O = Webernetz.net

---
No client certificate CA names sent
Peer signing digest: SHA256
Peer signature type: RSA-PSS
Server Temp Key: X25519, 253 bits
---
SSL handshake has read 1486 bytes and written 399 bytes
Verification error: self signed certificate
---
New, TLSv1.3, Cipher is TLS_AES_256_GCM_SHA384
Server public key is 2048 bit
Secure Renegotiation IS NOT supported
Compression: NONE
Expansion: NONE
No ALPN negotiated
Early data was not sent
Verify return code: 18 (self signed certificate)
---
---
Post-Handshake New Session Ticket arrived:
SSL-Session:
    Protocol  : TLSv1.3
    Cipher    : TLS_AES_256_GCM_SHA384
    Session-ID: C86198747196918F79D8672891201203F2C9C477EC6862A2DB3BAF9EB3E6D1C1
    Session-ID-ctx:
    Resumption PSK: E6F64A2948EF5D1071A2101A47ABAEAFB4CA7668B4D86441A2F992DF9C26EB3F50149A64DFD8B03321C42EB5D762C506
    PSK identity: None
    PSK identity hint: None
    SRP username: None
    TLS session ticket lifetime hint: 7200 (seconds)
    TLS session ticket:
    0000 - 11 a1 ff 4f e4 8c 05 98-4f 35 7e a4 33 f9 f1 58   ...O....O5~.3..X
    0010 - fb 6f 18 1a 5e 99 cd fa-bb 9a e6 63 f2 86 d6 62   .o..^......c...b
    0020 - 04 8a 03 7a 4f 14 58 ee-2c e7 62 94 07 a8 46 7a   ...zO.X.,.b...Fz
    0030 - 5a f4 fd ec 33 55 95 b1-f7 54 d6 3b e6 3e d3 bc   Z...3U...T.;.>..
    0040 - a0 8c c5 4b da c7 81 4f-1f ce c4 dd 32 3f 3c f5   ...K...O....2?<.
    0050 - 35 ef 00 aa 00 af a9 f8-60 c8 a0 a7 a4 61 df 37   5.......`....a.7
    0060 - 85 d8 0e 6b dd 78 8d 82-dc e8 63 23 ee 61 9d 49   ...k.x....c#.a.I
    0070 - a1 a6 a5 05 8c 5b 14 63-a7 88 09 80 f8 3c 66 50   .....[.c.....<fP
    0080 - 6f 4c 16 b4 44 c6 12 cb-93 d5 38 1c 7c 0c 28 7d   oL..D.....8.|.(}
    0090 - 18 6c 01 c4 66 8e 7d e5-f3 74 8e bb fe f5 77 35   .l..f.}..t....w5
    00a0 - 4b 8f 0d 84 b9 2a 45 86-31 eb 9a a5 a6 ff 4b 4f   K....*E.1.....KO
    00b0 - fa 20 68 55 1a 68 56 15-ef 30 e1 ed 05 90 0f 34   . hU.hV..0.....4
    00c0 - ec 6c ad 9c 48 39 e7 13-9d 5c c5 ea eb e6 ab b2   .l..H9...\......

    Start Time: 1624434726
    Timeout   : 7200 (sec)
    Verify return code: 18 (self signed certificate)
    Extended master secret: no
    Max Early Data: 0
---
read R BLOCK
^C
And to enumerate the provided TLS ciphers, use Nmap again. However, please note that Nmap does not support TLSv1.3 at the moment (Nmap 7.91):
nmap --script ssl-enum-ciphers -Pn -p 6514 <FQDN-of-the-syslog-server>
My example:
weberjoh@nb17-lx2:~$ nmap --script ssl-enum-ciphers -Pn -p 6514 test2.weberlab.de
Host discovery disabled (-Pn). All addresses will be marked 'up' and scan times will be slower.
Starting Nmap 7.91 ( https://nmap.org ) at 2021-06-23 08:31 UTC
Nmap scan report for test2.weberlab.de (194.247.5.27)
Host is up (0.00049s latency).
Other addresses for test2.weberlab.de (not scanned): 2001:470:1f0b:16b0:20c:29ff:fea8:26f7

PORT     STATE SERVICE
6514/tcp open  syslog-tls
| ssl-enum-ciphers:
|   TLSv1.2:
|     ciphers:
|       TLS_ECDHE_RSA_WITH_AES_256_GCM_SHA384 (ecdh_x25519) - A
|       TLS_DHE_RSA_WITH_AES_256_GCM_SHA384 (dh 2048) - A
|       TLS_ECDHE_RSA_WITH_CHACHA20_POLY1305_SHA256 (ecdh_x25519) - A
|       TLS_DHE_RSA_WITH_CHACHA20_POLY1305_SHA256 (dh 2048) - A
|       TLS_ECDHE_RSA_WITH_AES_128_GCM_SHA256 (ecdh_x25519) - A
|       TLS_DHE_RSA_WITH_AES_128_GCM_SHA256 (dh 2048) - A
|       TLS_ECDHE_RSA_WITH_AES_256_CBC_SHA384 (ecdh_x25519) - A
|       TLS_DHE_RSA_WITH_AES_256_CBC_SHA256 (dh 2048) - A
|       TLS_ECDHE_RSA_WITH_AES_128_CBC_SHA256 (ecdh_x25519) - A
|       TLS_DHE_RSA_WITH_AES_128_CBC_SHA256 (dh 2048) - A
|       TLS_ECDHE_RSA_WITH_AES_256_CBC_SHA (ecdh_x25519) - A
|       TLS_DHE_RSA_WITH_AES_256_CBC_SHA (dh 2048) - A
|       TLS_ECDHE_RSA_WITH_AES_128_CBC_SHA (ecdh_x25519) - A
|       TLS_DHE_RSA_WITH_AES_128_CBC_SHA (dh 2048) - A
|       TLS_RSA_WITH_AES_256_GCM_SHA384 (rsa 2048) - A
|       TLS_RSA_WITH_AES_128_GCM_SHA256 (rsa 2048) - A
|       TLS_RSA_WITH_AES_256_CBC_SHA256 (rsa 2048) - A
|       TLS_RSA_WITH_AES_128_CBC_SHA256 (rsa 2048) - A
|       TLS_RSA_WITH_AES_256_CBC_SHA (rsa 2048) - A
|       TLS_RSA_WITH_AES_128_CBC_SHA (rsa 2048) - A
|     compressors:
|       NULL
|     cipher preference: server
|_  least strength: A

Nmap done: 1 IP address (1 host up) scanned in 0.82 seconds
![]()
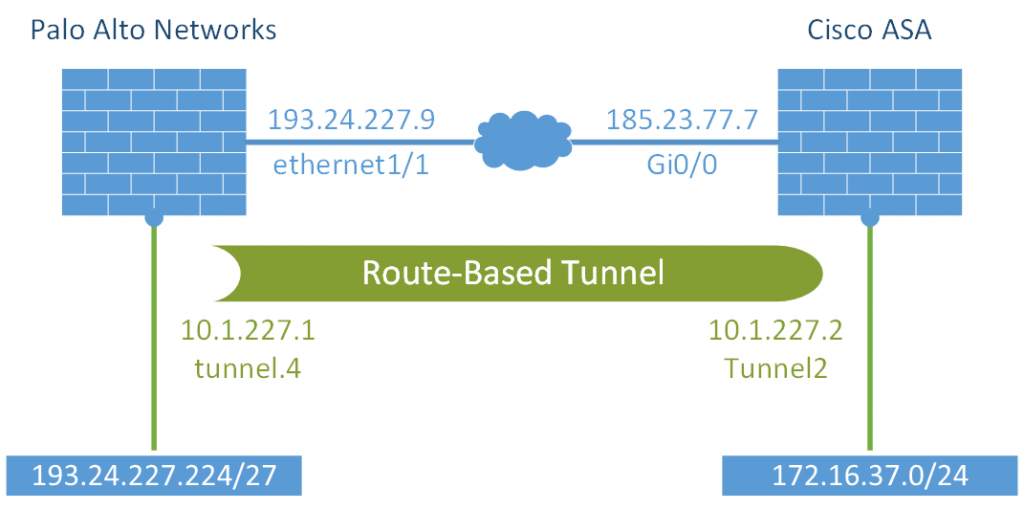
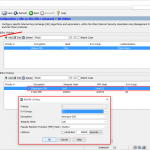
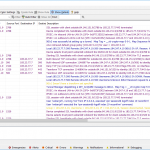
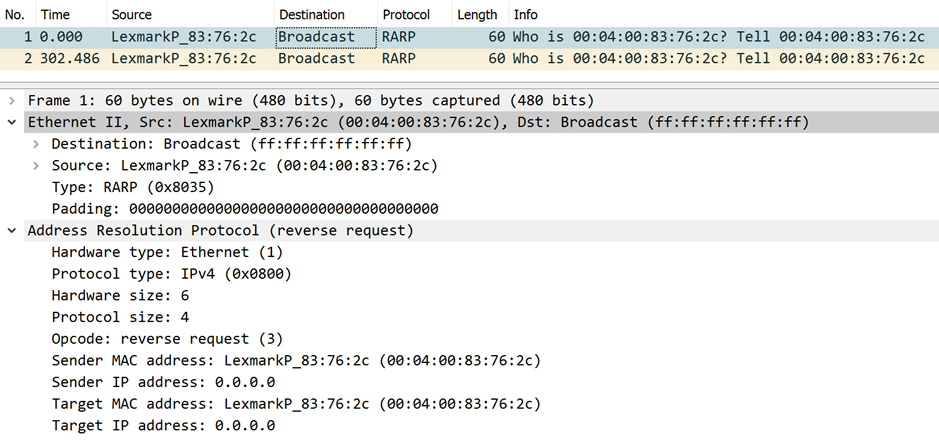
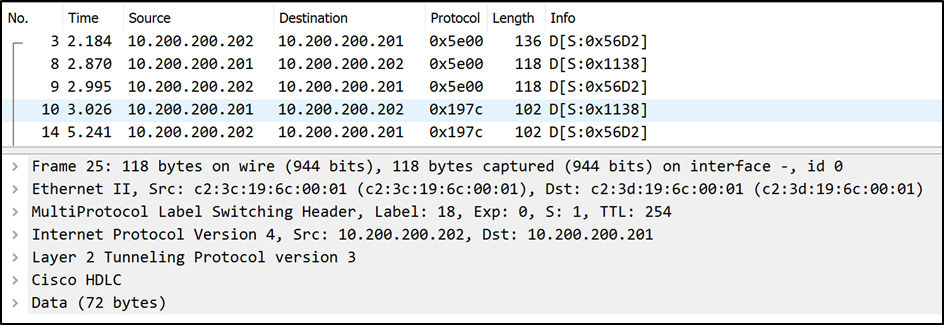
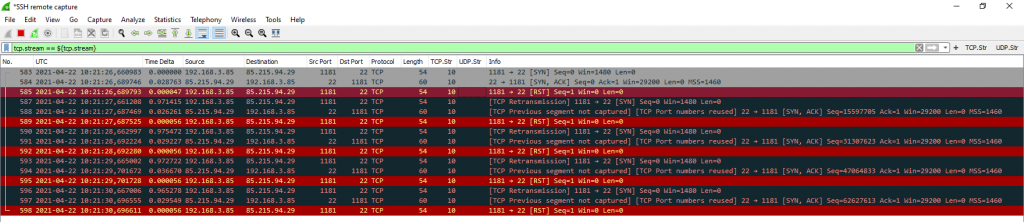
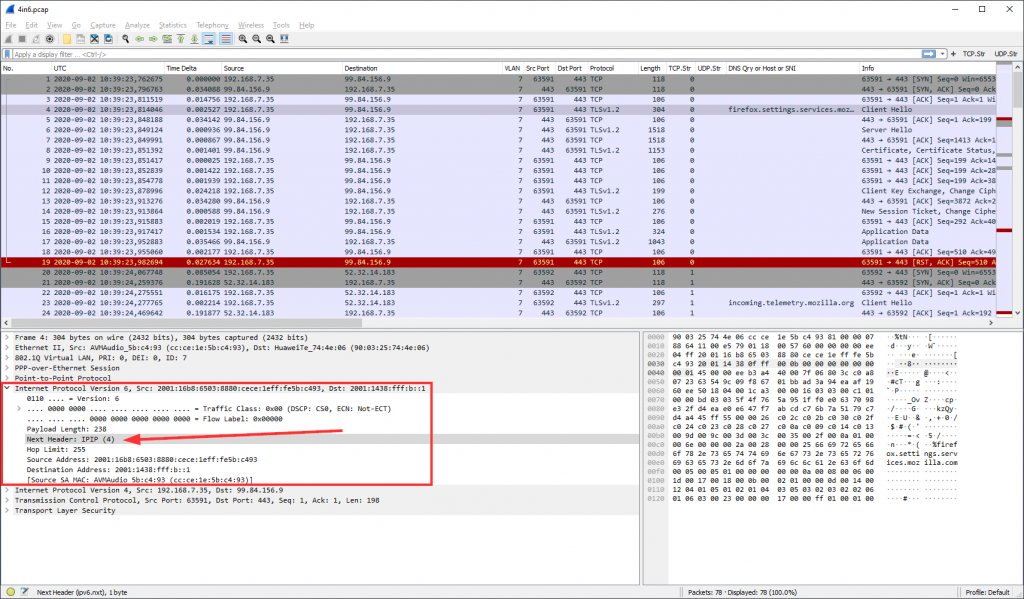
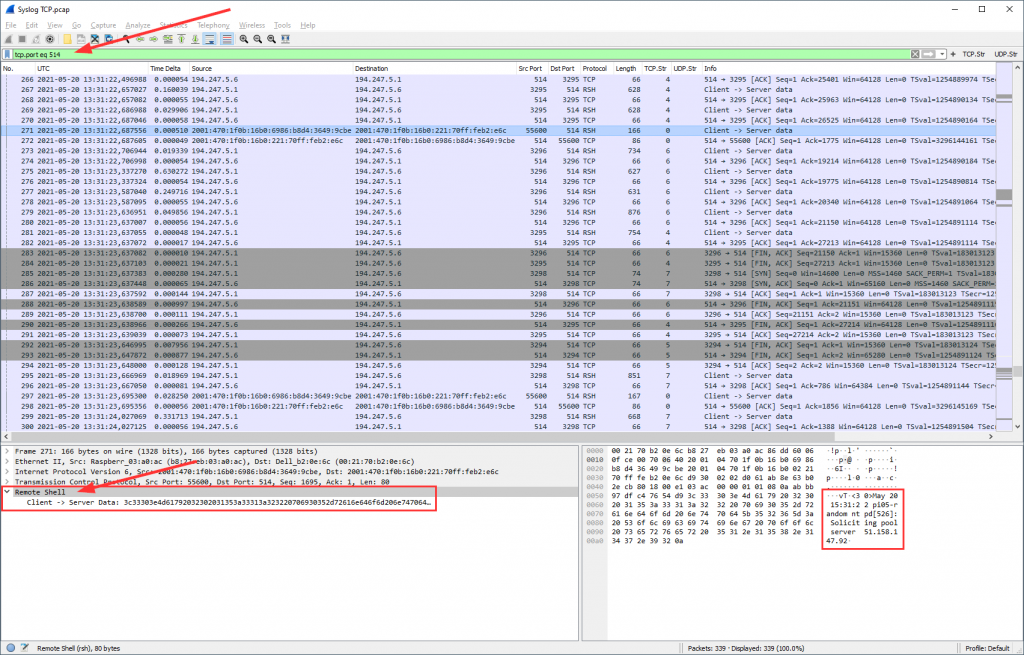
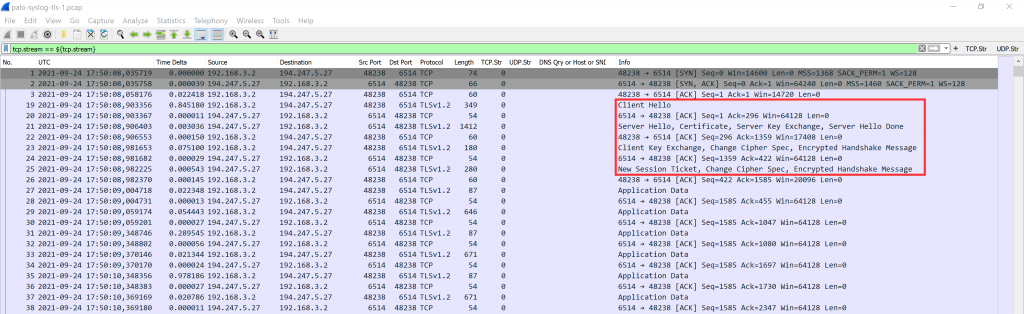
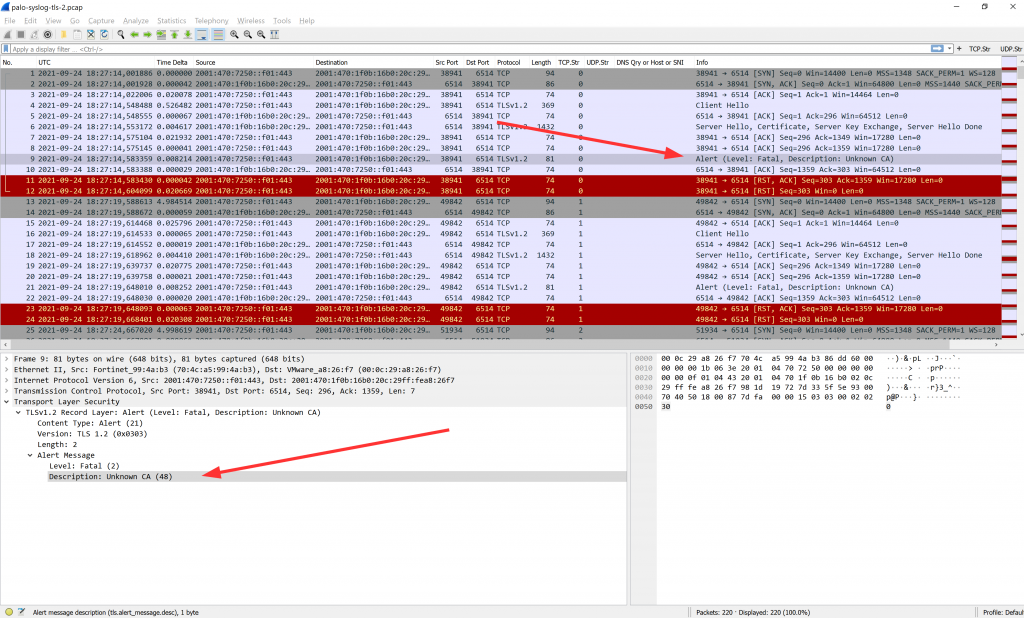
A Little Capture
And by the way: This is what it looks like in Wireshark. Standard TLS handshake, that is: client hello, server hello, certificate, server key exchange, client key exchange, and so on, finally followed by (unreadable since encrypted) application data:
![]()
You can find these captured packets in my most recent Ultimate PCAP.
All the best! God bless you.
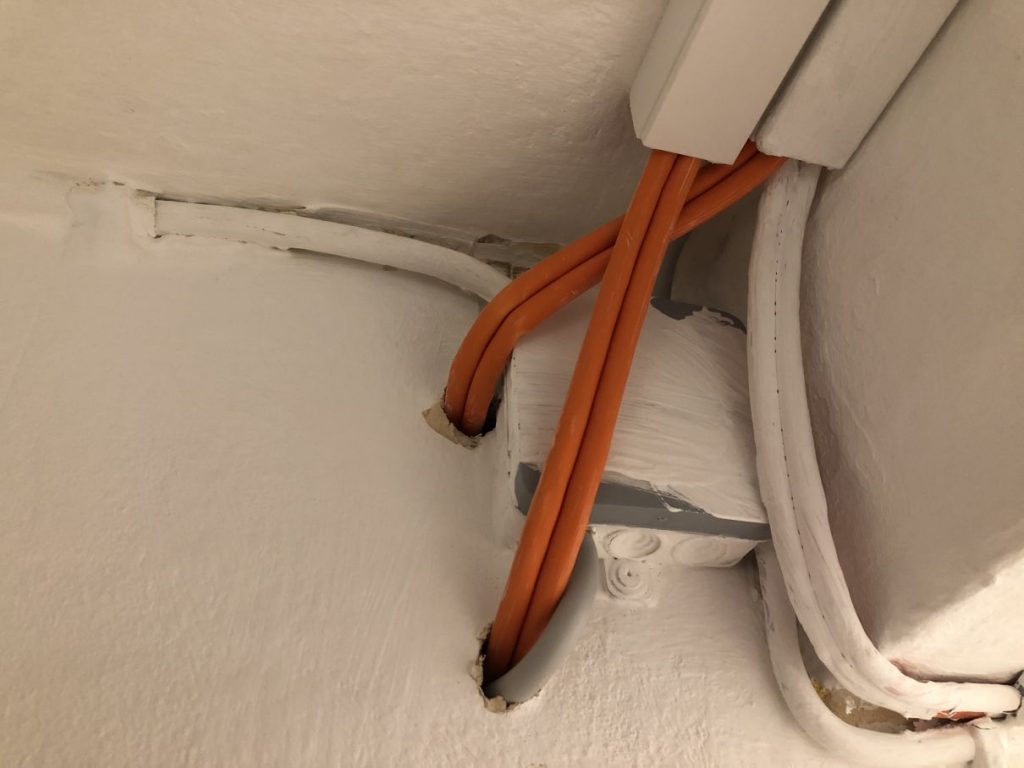
Featured image “journals” by Meagan is licensed under CC BY-NC 2.0.